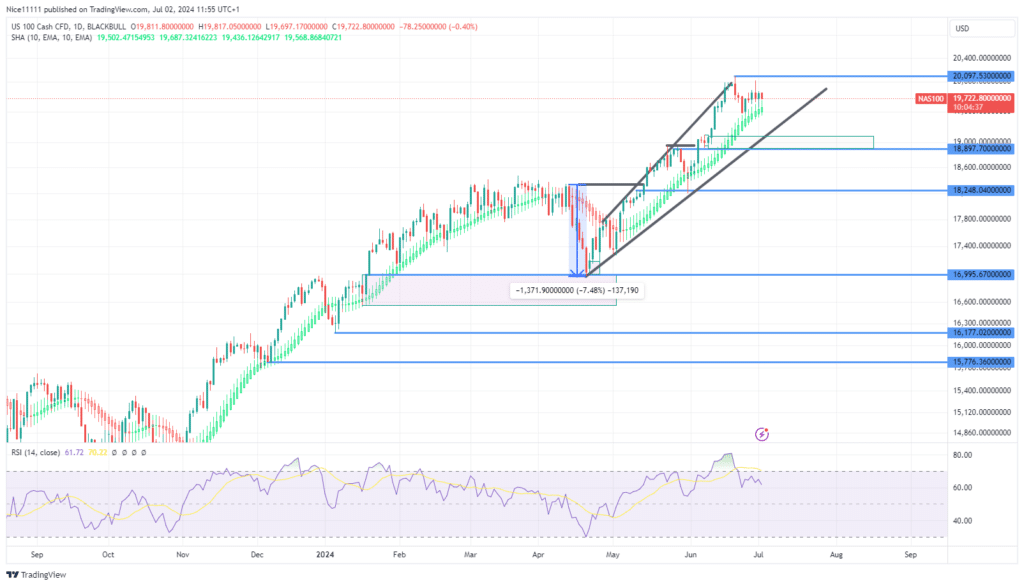
Nasdaq 100 achieved a new all-time high in June, reaching the significant psychological price level of 20,000.0. This milestone was accompanied by indications of bullish exhaustion from the Relative Strength Index (RSI), which prompted the market to enter a correction phase.
In April, the Nasdaq 100 experienced a significant pullback within its upward trajectory, resulting in a 7.5% price decline. On April 19, the Stochastic indicator showed that the price had become oversold, which triggered an immediate bullish reversal. This reversal marked the beginning of a restoration of the upward trend, which has since taken the form of an expanding channel.
Despite the current price decline, the market remains fundamentally bullish. This retracement follows the establishment of the all-time high at 20,000.0. The Smoothed Heikin Ashi Candles, which continue to show a green hue beneath the daily price levels, suggest that the market’s bullish sentiment is intact.
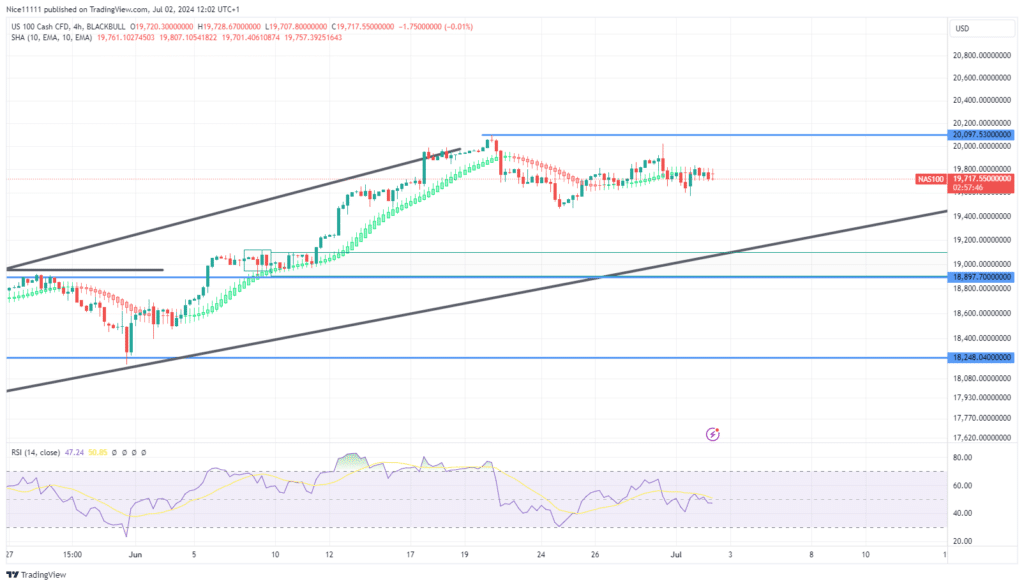
Nasdaq 100 Short-term Trend: Ranging
On the lower timeframe (4-hour chart), the Nasdaq 100 is exhibiting sideways price movement. This range-bound activity reflects the correction phase that followed the strong upward push to 20,000.0. The demand level at 19,000.0 is reinforced by a bullish order block on the 24-hour chart. This retracement towards the bullish order block presents a promising setup for those following forex signals.
The market’s behavior suggests that the Nasdaq 100 is undergoing a healthy correction within a broader bullish context. Traders and investors should closely monitor the key levels and technical indicators to capitalize on potential opportunities in this market.
Note: Learn2.trade is not a financial advisor. Do your research before investing your funds in any financial asset, product, or event. We are not responsible for your investment results.
Trade on MT4 with Leverage up to 1:500! Trade on MT4 with Leverage up to 1:500!
X
We use cookies to ensure that we give you the best experience on our website. If you continue to use this site we will assume that you are happy with it.