Key Resistance Zones: 16000, 16500, 17000
Key Support Zones: 13500, 13000, 12500
NASDAQ 100 (NAS100) Long-term Trend: Bearish
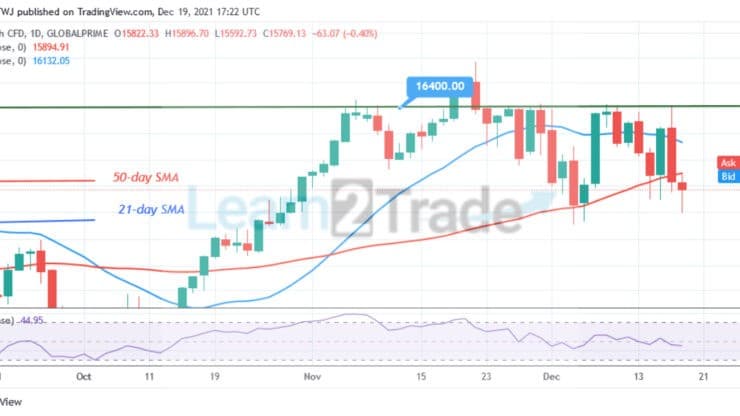
NAS100 price has broken below the moving averages as it battles resistance at 16400. Since November 4 uptrend the bulls are yet to break above level 16400 overhead resistance. Buyers have retested the overhead resistance on five occasions but were unable to breach the resistance. The index will fall below or above the moving averages after each rejection. For the past three days, the candlesticks have protruding long tails pointing to level 15600 support. The long tails indicate that the current support is a strong buying pressure.
Daily Chart Indicators Reading:
The index is at level 44 of the Relative Strength Index for period 14. It indicates that NAS100 has fallen to the downtrend zone and it is falling on the downside. The 21-day and the 50-day line moving averages are sloping horizontally indicating the sideways move.
NASDAQ 100 (NAS100) Medium-term Trend: Bullish
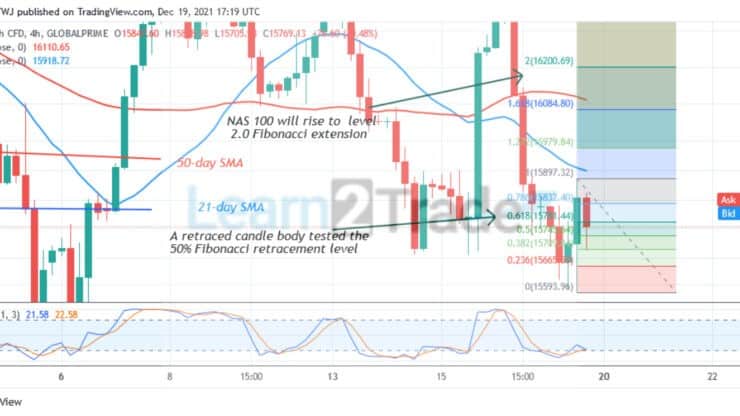
On the 4- hour chart, NAS100 is in an uptrend but it is retracing to the downside. The uptrend will resume when the retracement ends. Meanwhile, on December 17 uptrend, a retraced candle body tested the 50% Fibonacci retracement level. The retracement indicates that NAS100 will rise to level 2.0 Fibonacci extension or level 16200.69.
4-hour Chart Indicators Reading
NAS100 is above the 25% range of the daily stochastic. The index is in a bullish momentum. The 21-day SMA and the 50-day SMA are sloping horizontally indicating the sideways move.
General Outlook for NASDAQ 100 (NAS100)
NAS100 has resumed upward move as it battles resistance at 16400. The uptrend is likely as the index fell to the oversold region of the market. The index will resume an upward movement when it breaks above level 15900.
You can purchase crypto coins here: Buy Token
Note: Learn2.Trade is not a financial advisor. Do your research before investing your funds in any financial asset or presented product or event. We are not responsible for your investing results
- Broker
- Min Deposit
- Score
- Visit Broker

- Award-winning Cryptocurrency trading platform
- $100 minimum deposit,
- FCA & Cysec regulated

- 20% welcome bonus of upto $10,000
- Minimum deposit $100
- Verify your account before the bonus is credited
- Fund Moneta Markets account with a minimum of $250
- Opt in using the form to claim your 50% deposit bonus
Learn to Trade
Never Miss A Trade Again

Signal Notification
Real-time signal notifications whenever a signal is opened, closes or Updated

Get Alerts
Immediate alerts to your email and mobile phone.

Entry Price Levels
Entry price level for every signal Just choose one of our Top Brokers in the list above to get all this free.