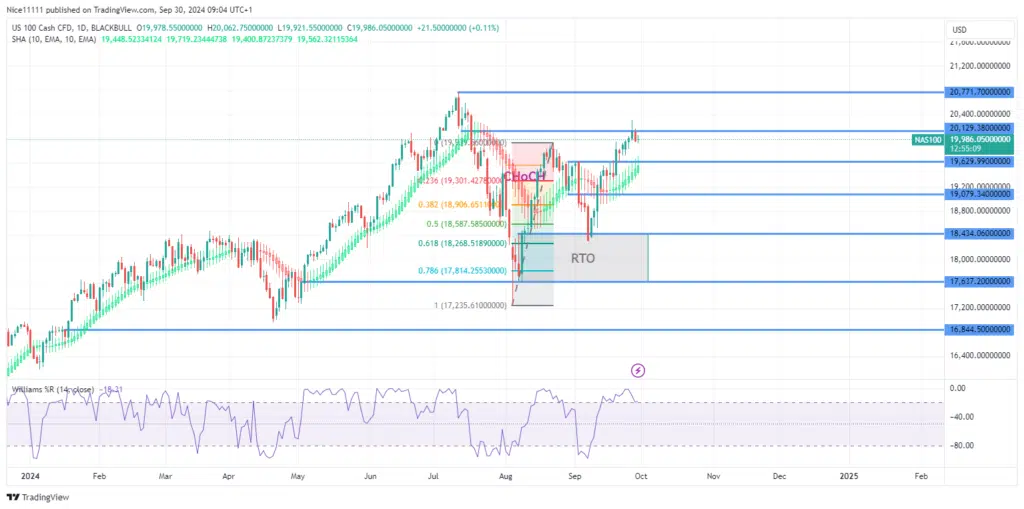
The Nasdaq 100 index is showing signs of fading bullish momentum. After a pullback to the bullish order block at 18,434.0, the current bullish movement emerged with a gap, indicating strong buying pressure. However, as the price moves upward, the momentum continues to decrease.
Since reaching the 19,994.0 key level during its upward movement, the bullish momentum has notably weakened. This decline is evident in the formation of smaller candles that have appeared since hitting this key level. These smaller candles suggest a lack of commitment from the NAS100 price and indicate potential exhaustion in the upward drive.
Additionally, the Average Directional Index (ADX) has been consistently declining since the upward trend resumed at the bullish reversal level of 17,637.0 in early August. This decline in the ADX highlights a weakening trend, showing that the bullish momentum is not only fading but also losing strength.
Nasdaq 100 Short-Term Trend: Bearish
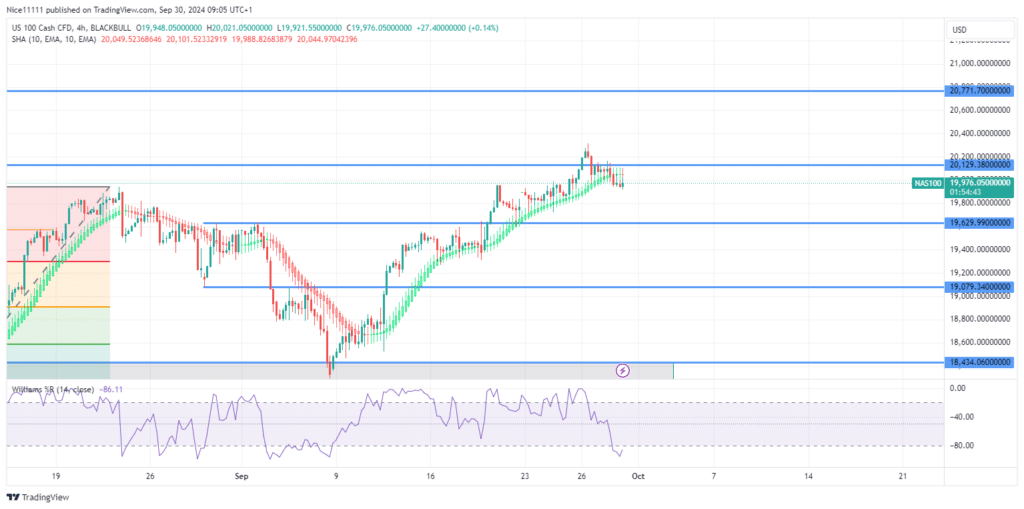
In the lower timeframes, the Stochastic indicator (4-hour timeframe) shows the market as oversold, a condition also reflected in the higher timeframe (daily chart). While this oversold condition often signals a potential reversal, the current price stiffness suggests a reaccumulation phase that may lead to broader expansion. The overall market structure remains bullish, indicating the possibility of a future uptrend.
A bullish breakout accompanied by increased volume could signal a move toward 20,771.0, making it essential to monitor volume trends closely for potential opportunities, especially for those using forex signals.
Note: Learn2.trade is not a financial advisor. Do your research before investing your funds in any financial asset, product, or event. We are not responsible for your investment results.
Trade on MT4 with Leverage up to 1:500! Trade on MT4 with Leverage up to 1:500!
X
We use cookies to ensure that we give you the best experience on our website. If you continue to use this site we will assume that you are happy with it.