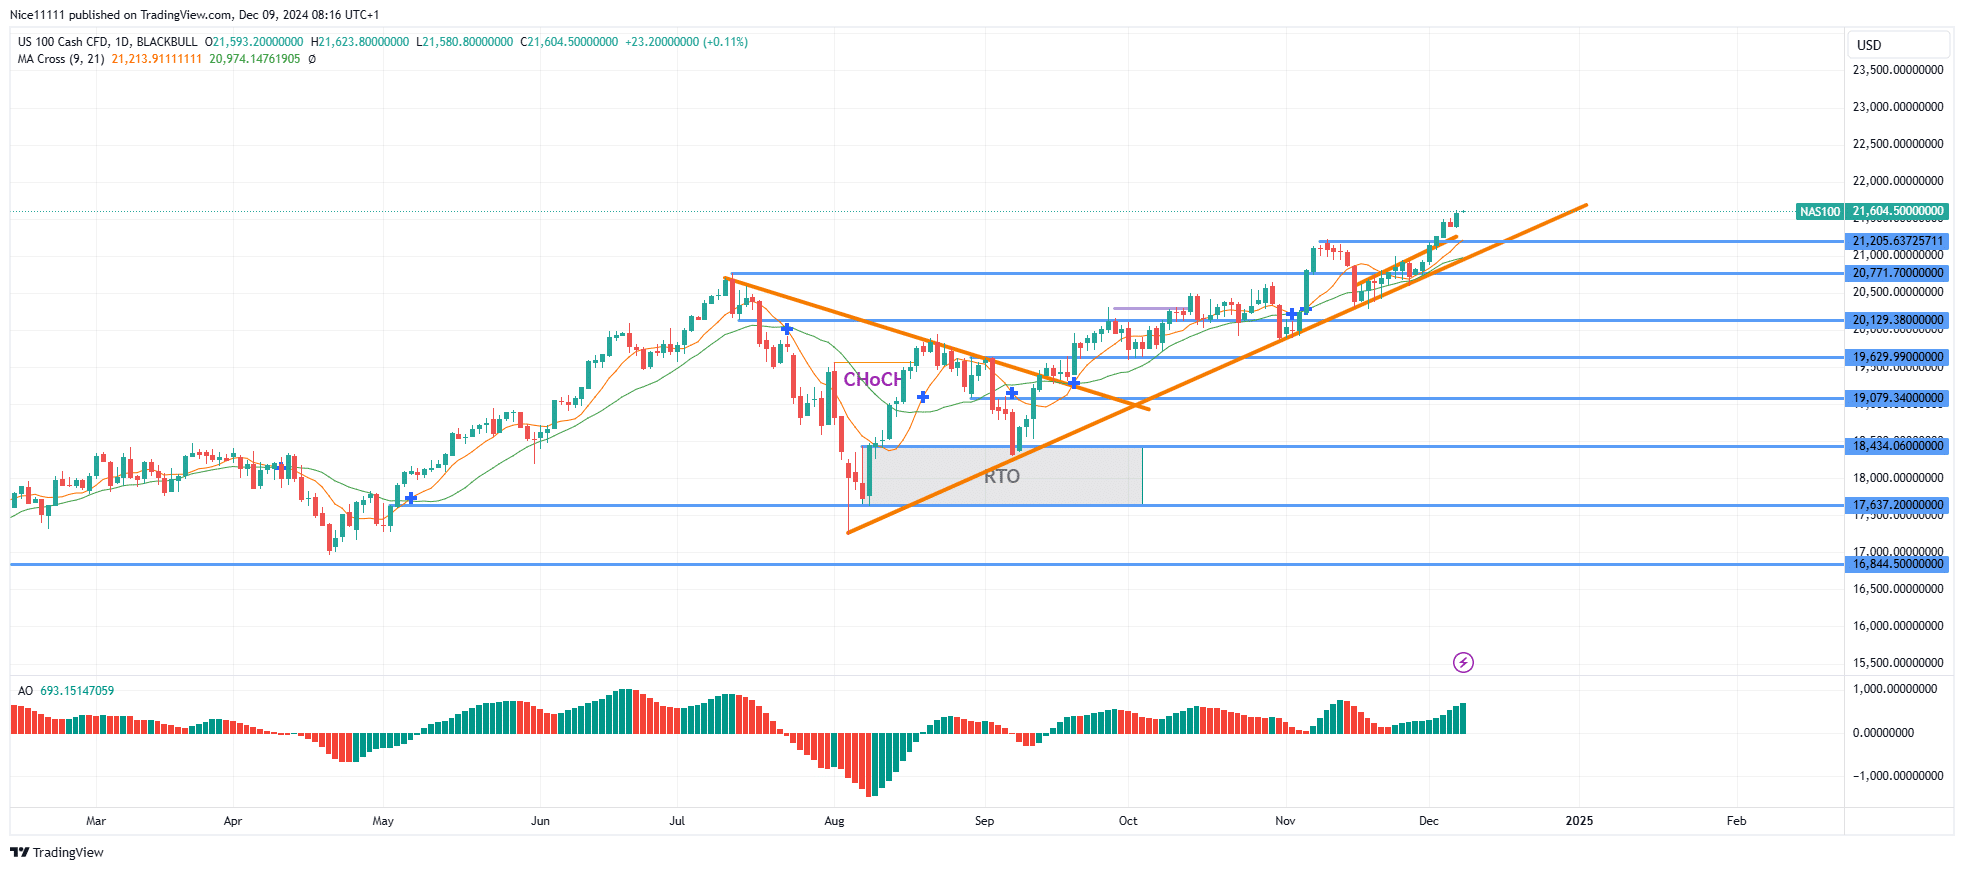
The Nasdaq 100 continues its remarkable bullish run, supported by a well-established trendline. Recently, it has surged past its previous swing high and all-time high of 21,205.0, signaling renewed bullish momentum.
In November, the Nasdaq 100 reached a historic milestone, achieving a new all-time high at 21,205.0. Following this, a retracement tested a bullish order block, setting the stage for another rally. However, the momentum initially weakened, leading to a more gradual climb rather than the anticipated strong bullish surge.
The steady upward movement caused the 9-period and 21-period Moving Averages to converge, reflecting reduced momentum. Despite this, the combined support from the bullish trendline and the Moving Averages created optimal entry points for traders, further strengthening the index’s long-term bullish outlook.
Nasdaq 100 Short-Term Trend: Bullish
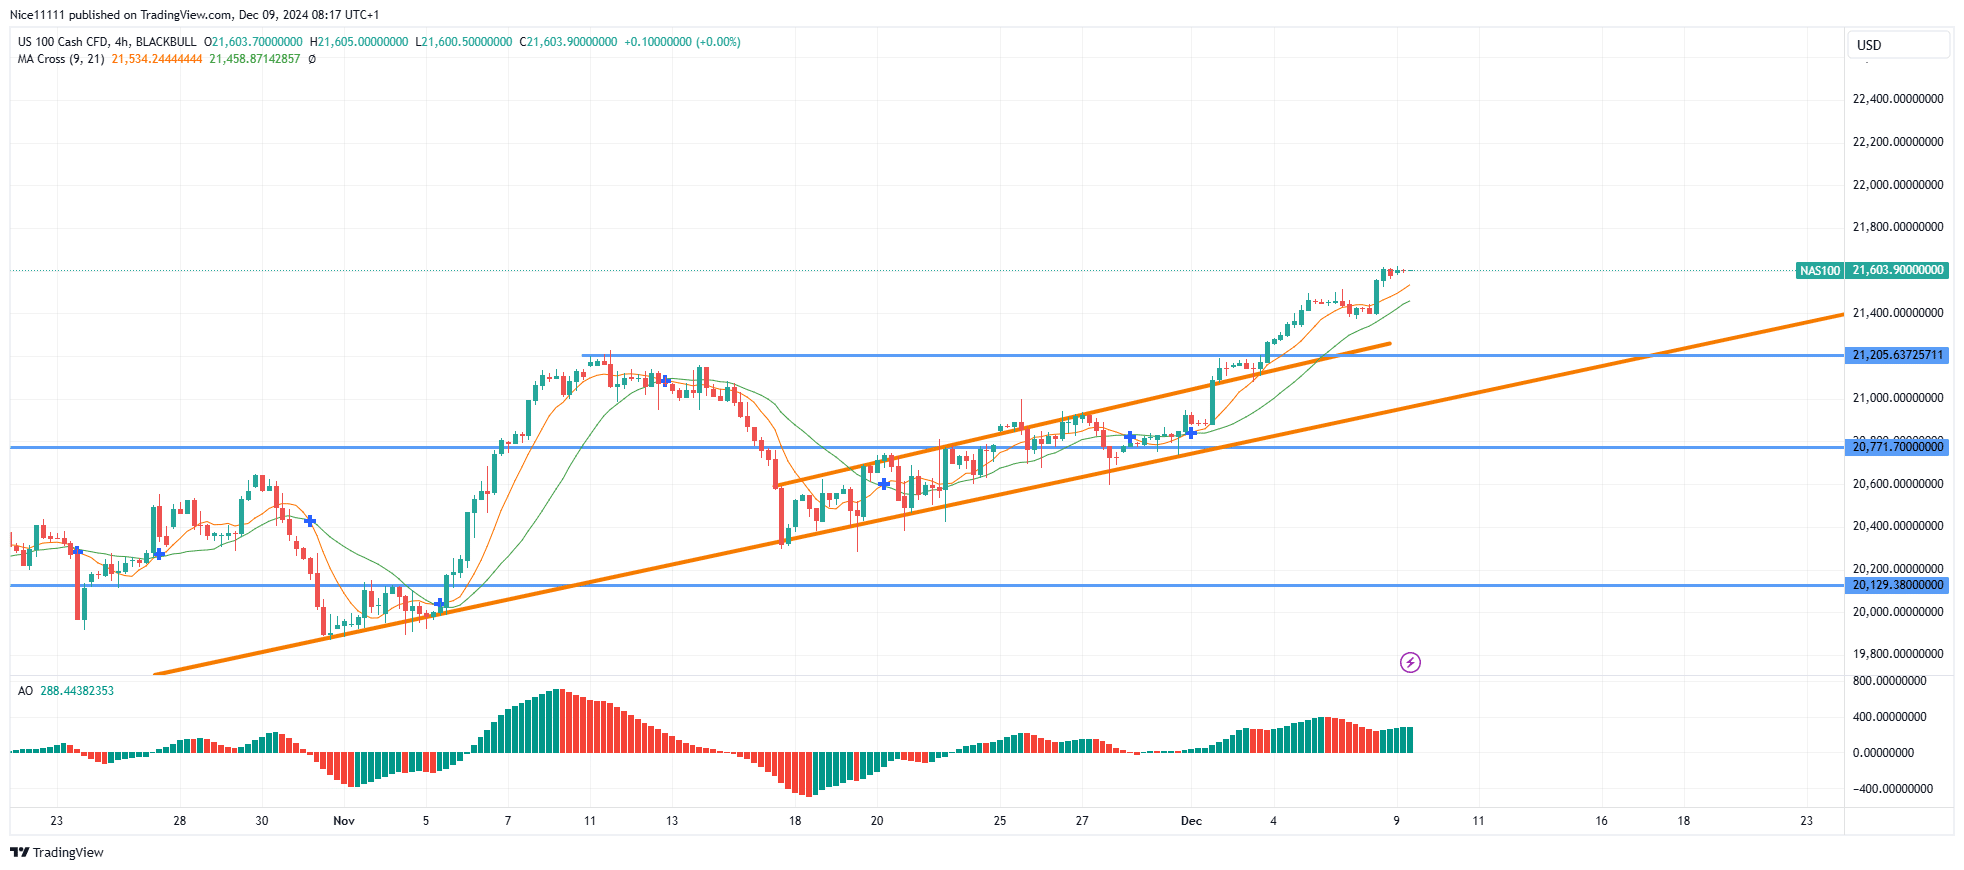
Throughout November, the Nasdaq 100 exhibited a narrow parallel channel on the lower timeframe 4-hour chart. This pattern reflected a steady, incremental upward trend, acting as a consolidation phase. The channel eventually culminated in a powerful breakout, propelling the market higher and marking a strong bullish displacement.
This breakout highlights the Nasdaq 100’s strength, with prices now targeting key psychological levels at 22,000.0, 22,500.0, and 23,000.0. Traders may find potential opportunities fueled by forex signals, as the index maintains its bullish trajectory.
Note: Learn2.trade is not a financial advisor. Do your research before investing your funds in any financial asset, product, or event. We are not responsible for your investment results.
Trade on MT4 with Leverage up to 1:500! Trade on MT4 with Leverage up to 1:500!
X
We use cookies to ensure that we give you the best experience on our website. If you continue to use this site we will assume that you are happy with it.