NAS100 Analysis – August 17
NAS100 maintains a steady bullish trajectory supported by technical momentum. The index has consistently traded above the 9-day SMA, currently positioned near $23,570. The Relative Strength Index (RSI) hovers around 60, indicating healthy bullish momentum while avoiding overbought conditions. This alignment of trend and momentum indicators highlights a market environment where buyers remain in control, reinforcing the broader bullish bias.
NAS100 Key Levels
Resistance Levels: $24,050, $25,000, $26,040
Support Levels: $23,000, $22,140, $20,360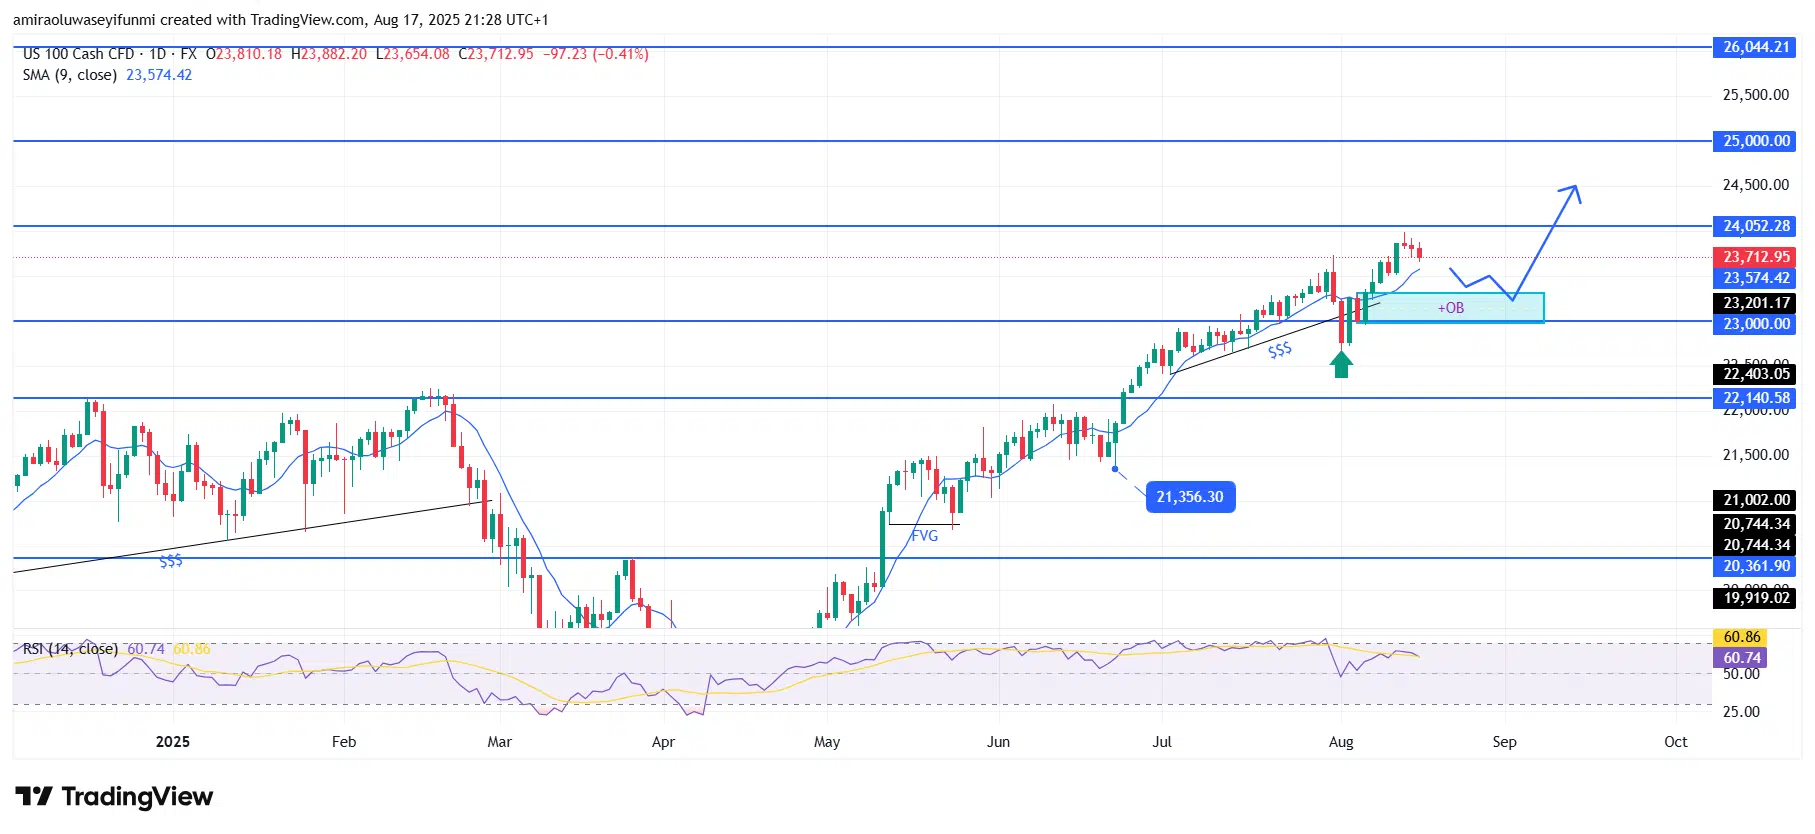
NAS100 Long-Term Trend: Bullish
The index recently broke through resistance around $23,010 and has now established this area as a new demand zone. The short-term consolidation near $23,700–$23,800 reflects a pause in the market, allowing momentum to reset before the next upward move. The presence of an order block around $23,000 provides additional structural support, while higher lows continue to strengthen the market’s bullish structure.
Looking forward, if buying pressure persists, NAS100 is expected to test the $24,050 resistance level in the short term. A breakout above this level could pave the way toward $25,000, with further upside potential to $26,040 if momentum accelerates. On the other hand, a corrective pullback toward $23,000 is possible, but as long as this support holds, the overall bullish trend remains intact.
NAS100 Short-Term Trend: Bullish
Currently, NAS100 is consolidating after pulling back from the $24,050 resistance, with price holding above the $23,200 demand zone. The 9-day SMA near $23,800 is acting as dynamic resistance, but the overall market structure remains bullish.
RSI is positioned around mid-levels, suggesting room for further upside as momentum strengthens. A rebound from the $23,000–$23,200 order block could trigger a move toward $24,050 and eventually $25,000. For traders, monitoring forex signals alongside technical setups may help identify favorable entry points within this bullish framework.
Make money without lifting your fingers: Start using a world-class auto trading solution
How To Buy Lucky Block – Guide, Tips & Insights | Learn 2 Trade
Note: Learn2.trade is not a financial advisor. Do your research before investing your funds in any financial asset, product, or event. We are not responsible for your investment results.
- Broker
- Min Deposit
- Score
- Visit Broker

- Award-winning Cryptocurrency trading platform
- $100 minimum deposit,
- FCA & Cysec regulated

- 20% welcome bonus of upto $10,000
- Minimum deposit $100
- Verify your account before the bonus is credited
- Fund Moneta Markets account with a minimum of $250
- Opt in using the form to claim your 50% deposit bonus
Learn to Trade
Never Miss A Trade Again

Signal Notification
Real-time signal notifications whenever a signal is opened, closes or Updated

Get Alerts
Immediate alerts to your email and mobile phone.

Entry Price Levels
Entry price level for every signal Just choose one of our Top Brokers in the list above to get all this free.
