NAS100 Analysis – January 18
NAS100 structure reflects strengthening capital inflows and positive trajectory. The NAS100 continues to operate within a well-supported upward framework, reinforced by constructive trend alignment and balanced momentum conditions. Price remains comfortably above its short-term average, signaling sustained buyer participation even as the market consolidates recent advances. The RSI is holding steady within the 50–55 range, reflecting healthy momentum without signs of overheating. This technical configuration suggests deliberate positioning by market participants rather than speculative, short-lived buying.
NAS100 Key Levels
Resistance Levels: $26040, $27000, $28000
Support Levels: $24050, $23000, $22140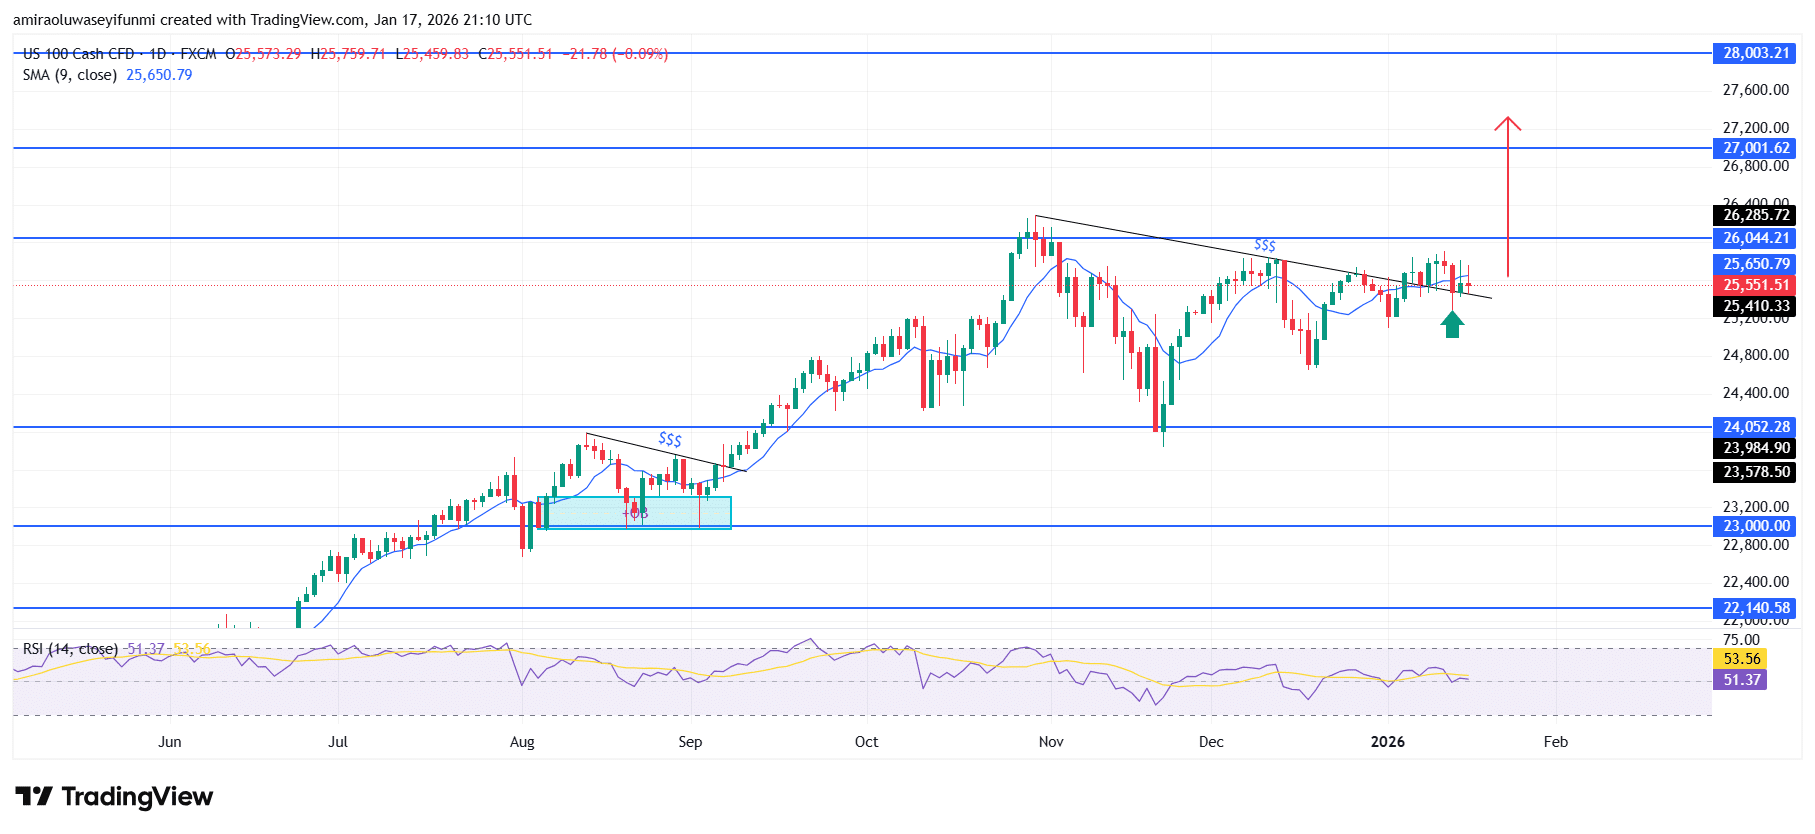
NAS100 Long-Term Trend: Bullish
Price action has been compressing beneath a descending resistance line in the $25,600–$25,700 region, signaling consolidation following the prior expansion phase. Repeated rejections near the $26,000–$26,100 zone confirm the presence of overhead supply, while consistent rebounds from the $25,400–$25,500 area reinforce this zone as an active demand base. The sequence of higher lows developing from the $24,900 region highlights underlying strength, and the current pause suggests that selling pressure remains controlled and largely absorbed.
Looking ahead, a firm daily close above $25,700 would likely confirm resolution of the corrective phase and open the path toward $26,300 and $27,000. Should momentum strengthen beyond these levels, price could extend toward the $28,000 region, where broader resistance may emerge. Conversely, only a decisive breakdown below $25,300 would meaningfully weaken the bullish structure and bring $24,900 back into focus. Overall, prevailing conditions continue to favor upside continuation, with consolidation acting as a foundation for the next advance rather than a reversal signal.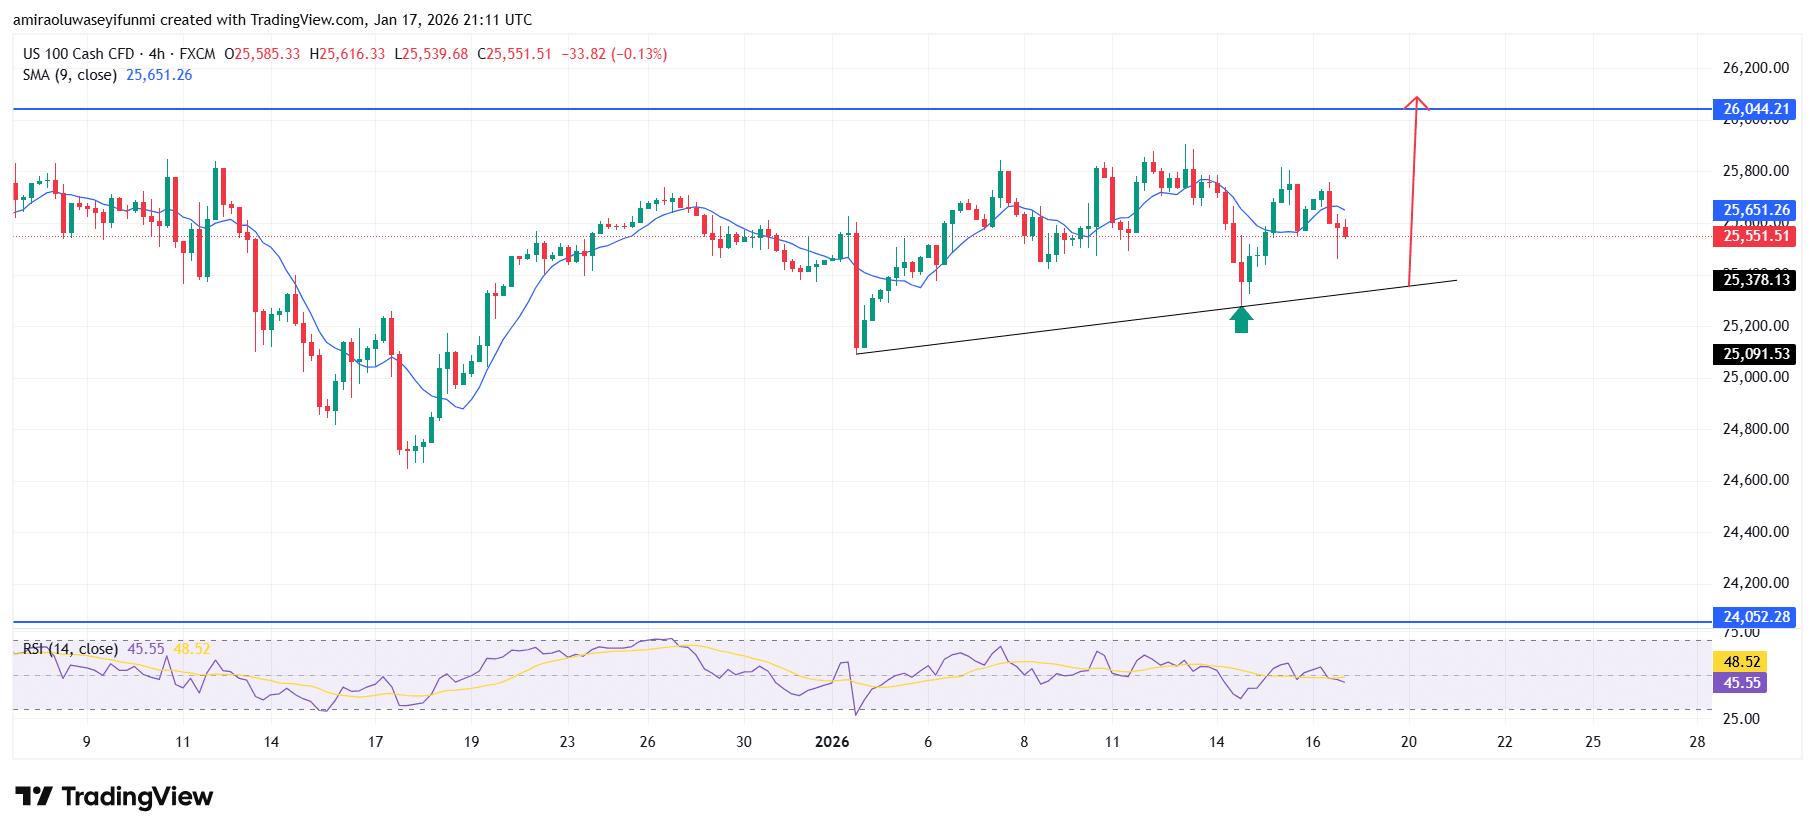
NAS100 Short-Term Trend: Bullish
NAS100 on the four-hour chart retains a bullish bias, supported by price holding above the rising trendline near $25,300. The index continues to trade close to the short-term moving average around $25,650, reflecting steady demand despite shallow pullbacks.
The formation of higher lows above $25,100 indicates ongoing absorption of sell pressure, while resistance remains clearly defined around the $26,000–$26,100 zone. A sustained break above $26,100 would likely confirm renewed upside momentum toward $26,400 and $26,800, aligning with prevailing forex signals and reinforcing the broader positive trajectory.
Make money without lifting your fingers: Start using a world-class auto trading solution
How To Buy Lucky Block
Note: Learn2.trade is not a financial advisor. Do your research before investing your funds in any financial asset, product, or event. We are not responsible for your investment results.
- Broker
- Min Deposit
- Score
- Visit Broker

- Award-winning Cryptocurrency trading platform
- $100 minimum deposit,
- FCA & Cysec regulated

- 20% welcome bonus of upto $10,000
- Minimum deposit $100
- Verify your account before the bonus is credited
- Fund Moneta Markets account with a minimum of $250
- Opt in using the form to claim your 50% deposit bonus
Learn to Trade
Never Miss A Trade Again

Signal Notification
Real-time signal notifications whenever a signal is opened, closes or Updated

Get Alerts
Immediate alerts to your email and mobile phone.

Entry Price Levels
Entry price level for every signal Just choose one of our Top Brokers in the list above to get all this free.