

Key Resistance Zones: 16000, 16500, 17000
Key Support Zones: 13500, 13000, 12500
NASDAQ 100 (NAS100) Long-term Trend: Bearish
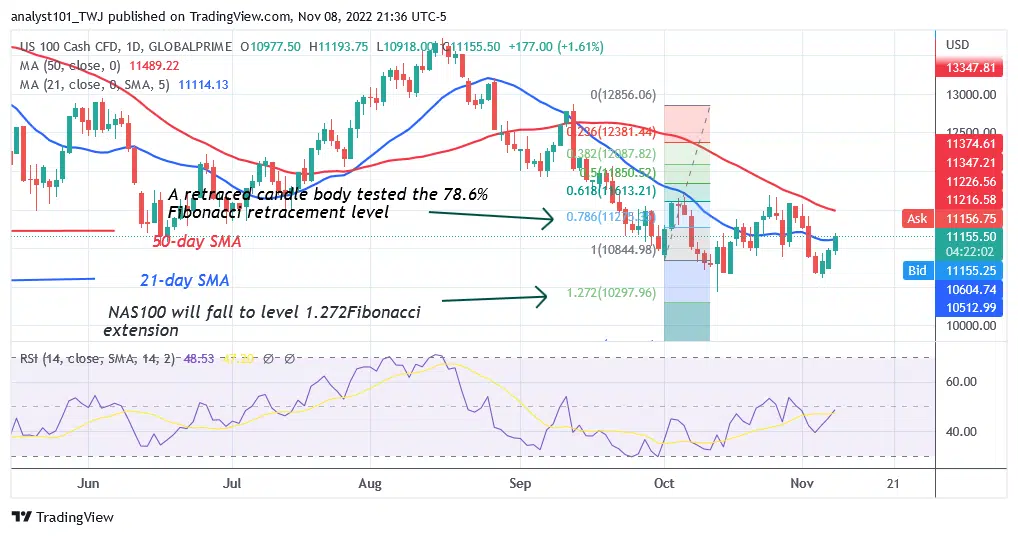
The NAS100 is in a downward trend as it challenges level 11600. Buyers were able to drive the index over the 21-day line SMA in the last price action, but they were unable to hold the price above the 50-day line SMA. The previous low at level 10431 will be the target for the bears to try to retest. The NAS100 performed an upward corrective on the October 3 decline, and a candle body tested the 78.6% Fibonacci retracement level. According to the correction, NAS100 will decline but turn around at level 1.272 of the Fibonacci extension, or level 10297.96.
Daily Chart Indicators Reading:
NAS100 is at level 48 on the Relative Strength Index for period 14.
A decline is possible because the indicator is in the downtrend zone.
A further decline is probable because the index price is below the moving average lines. The downward slopes of the 21-day and 50-day SMA lines serve as indicators of the downtrend.
NASDAQ 100 (NAS100) Medium-term Trend: Bearish
As it breaks below the moving average lines on the 4-hour chart, the NAS100 is in a downtrend. The bulls tested the barrier at level 11600 three times before they started to decline. NAS100 is currently overbought. The possibility exists that the selling pressure will ease.

4-hour Chart Indicators Reading
The daily stochastic’s level of 80 is below the NAS100. The momentum of the index is bearish. A sideways movement is shown by the moving average lines’ horizontal slant.
General Outlook for NASDAQ 100 (NAS100)
The moving average lines are preventing the NAS100 from moving higher as it challenges level 11600. The 21-day line SMA is currently acting as resistance for the upward movement. At level 10431, sellers will try to retest the previous bottom.
You can purchase crypto coins here: Buy LBLOCK
Note: Learn2.Trade is not a financial advisor. Do your research before investing your funds in any financial asset or presented product or event. We are not responsible for your investing results
- Broker
- Min Deposit
- Score
- Visit Broker

- Award-winning Cryptocurrency trading platform
- $100 minimum deposit,
- FCA & Cysec regulated

- 20% welcome bonus of upto $10,000
- Minimum deposit $100
- Verify your account before the bonus is credited


- Fund Moneta Markets account with a minimum of $250
- Opt in using the form to claim your 50% deposit bonus


