

NAS100 Analysis – February 23
NAS100 is experiencing a pullback before a potential bullish continuation toward higher levels. Technical indicators suggest this retracement is temporary within a broader uptrend. The price is currently testing the 9-day Simple Moving Average (SMA) at $21,980, a key short-term dynamic support level. The Stochastic Oscillator shows a sharp decline, with the %K line at 41.10 crossing below the %D line at 73.80, indicating the possibility of an oversold condition soon. While short-term selling pressure is evident, the market may be preparing for an upward reversal.
NAS100 Key Levels
Resistance Levels: $22,260, $23,000, $24,050
Support Levels: $20,760, $18,320, $17,250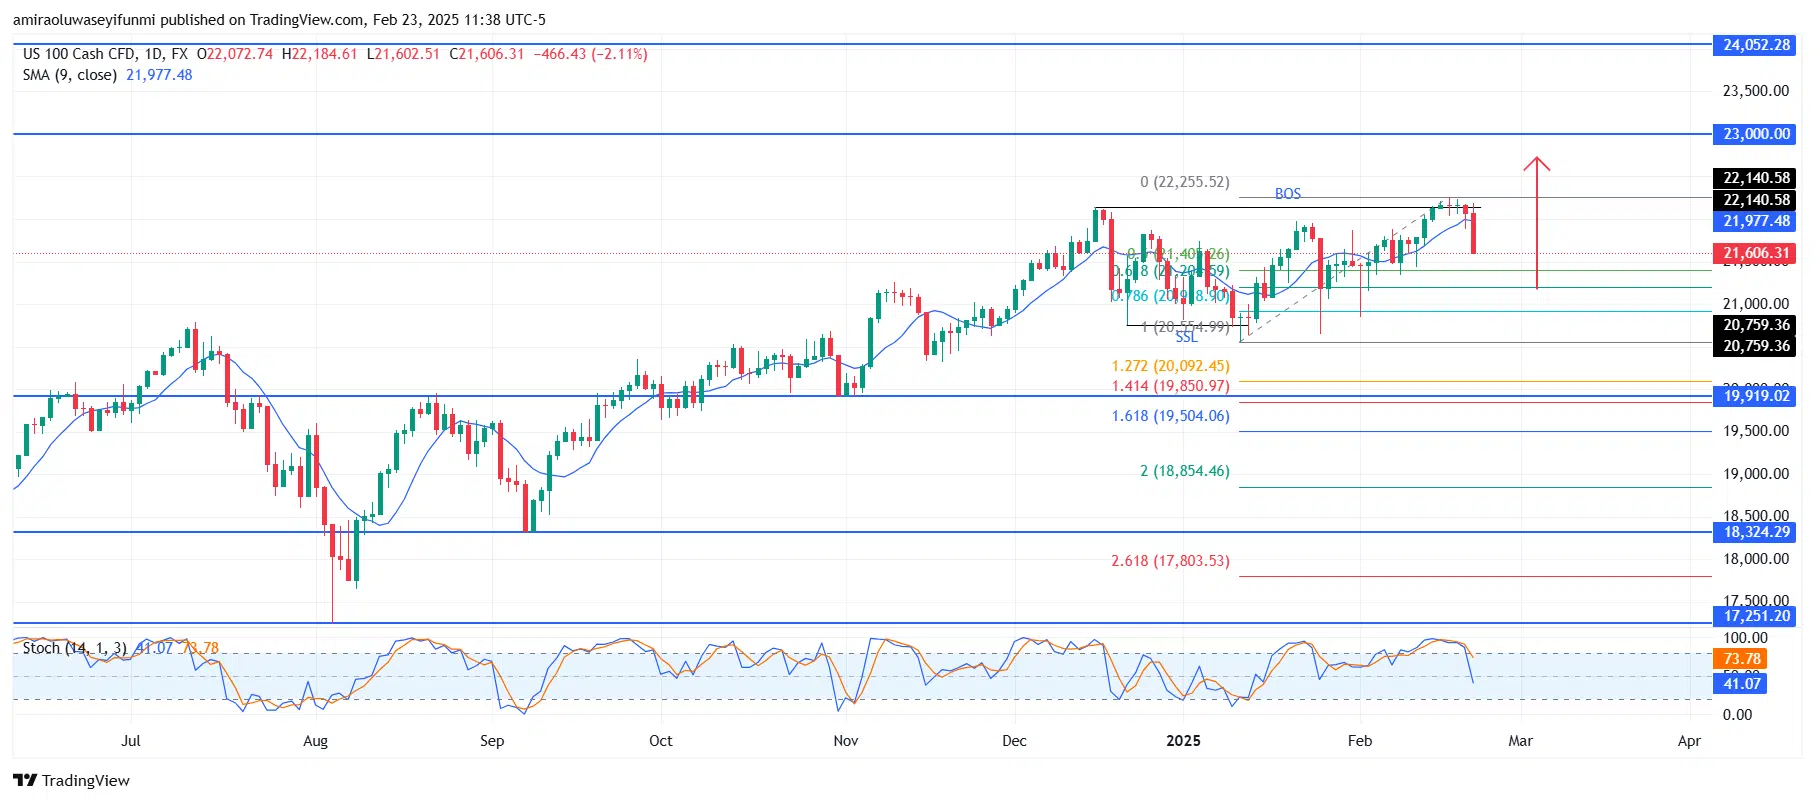
NAS100 Long-Term Trend: Bullish
Price action confirms that NAS100 remains in a bullish trend despite the recent decline, as the market previously broke structure to the upside. The ongoing retracement aligns with Fibonacci levels, with the 0.618 retracement zone near $21,400 acting as a potential demand area. Strong horizontal support is evident around $20,760, where buyers may enter the market aggressively. If the price finds support and forms bullish reversal patterns, the uptrend is likely to resume.
The overall outlook remains bullish, with NAS100 expected to regain upward momentum after this pullback. A bounce from support could drive the price back toward the recent high of $22,260, with further potential to reach the psychological resistance at $23,000. A confirmed breakout above $23,000 may lead to a rally toward $24,050 in the long term. However, if the retracement extends and the price drops below $19,920, it could indicate a shift in market structure and delay the bullish continuation.
NAS100 Short-Term Trend: Bearish
The four-hour chart indicates a short-term bearish trend, with the price breaking below the SMA. It is currently testing an ascending trendline, which, if breached, could lead to further declines toward $20,760.
Make money without lifting your fingers: Start using a world-class auto trading solution
How To Buy Lucky Block – Guide, Tips & Insights | Learn 2 Trade
Note: Learn2.trade is not a financial advisor. Do your research before investing your funds in any financial asset, product, or event. We are not responsible for your investment results.
- Broker
- Min Deposit
- Score
- Visit Broker

- Award-winning Cryptocurrency trading platform
- $100 minimum deposit,
- FCA & Cysec regulated

- 20% welcome bonus of upto $10,000
- Minimum deposit $100
- Verify your account before the bonus is credited


- Fund Moneta Markets account with a minimum of $250
- Opt in using the form to claim your 50% deposit bonus



