Monero – Guide, Tips & Insights | Learn 2 Trade (XMR) Price Analysis: May 23
In case the bears maintain their momentum, $184 support level will be penetrated down side, and Monero – Guide, Tips & Insights | Learn 2 Trade will reduce towards $161 and $136 levels. Failure to break down the $184 level, the price may bounce towards the $217, $244 and $273 resistance levels.
Key Levels:
Resistance Levels: $217, $244, $273
Support Levels: $184, $161, $136
XMRUSD Long-term Trend: Bearish
Monero – Guide, Tips & Insights | Learn 2 Trade is bearish on the daily chart. The high of $511 was reached by the bulls’ pressure on May 10. The bullish momentum failed with the formation of Evening star candle pattern. The price falls towards the support level of $161 after it breaks down the former support levels of $322, $281 and $244 levels. The price bounces and retest the $281 price level before it continues declining. At the moment, the price is breaking down $184 level.
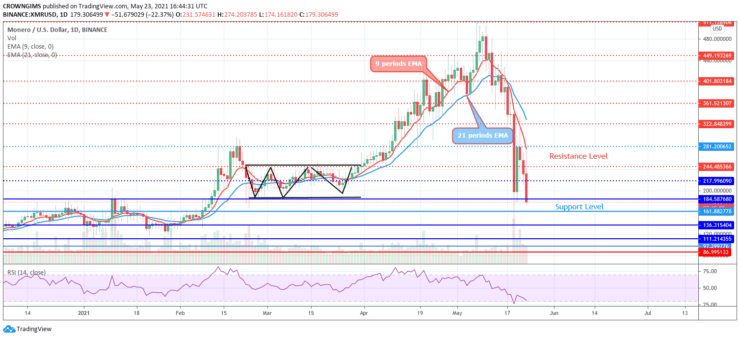
Monero – Guide, Tips & Insights | Learn 2 Trade price breaks down the dynamic support level and It is trading below the 9 periods EMA and 21 periods EMA at a distance as a sign of strong bearish movement. In case the bears maintain their momentum, $184 support level will be penetrated down side, and Monero – Guide, Tips & Insights | Learn 2 Trade will reduce towards $161 and $136 levels. Failure to break down the $184 level, the price may bounce towards the $217, $244 and $273 resistance levels. However, the relative strength index period 14 is at 25 levels with the signal line pointing down to indicate sell signal.
XMRUSD Price Medium-term Trend: Bearish
Monero – Guide, Tips & Insights | Learn 2 Trade is on the bearish movement on 4-Hour chart. The sellers’ pressure increases daily and the price is reducing accordingly. The bearish momentum pushes the price to the support level of $184 and bounces up towards the $322 resistance level. A bearish engulfing candle formed and the price is currently breaking the support level of $184.
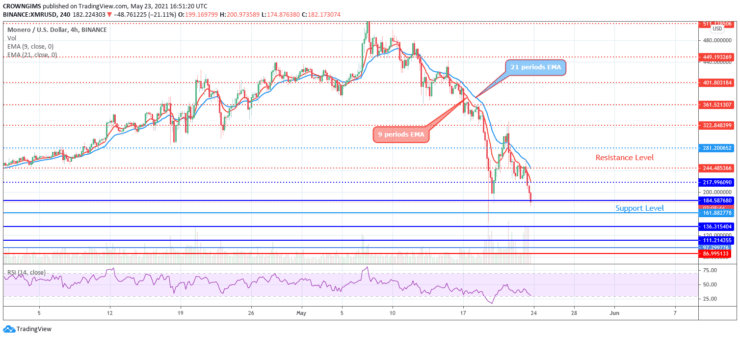
The price is trading below the two EMAs with the 9-day EMA below the 21-day EMA which indicate a bearish movement. The relative strength index is at 25 levels pointing down to indicate sell signal.
You can purchase crypto coins here: Buy coins
- Broker
- Min Deposit
- Score
- Visit Broker

- Award-winning Cryptocurrency trading platform
- $100 minimum deposit,
- FCA & Cysec regulated

- 20% welcome bonus of upto $10,000
- Minimum deposit $100
- Verify your account before the bonus is credited
- Fund Moneta Markets account with a minimum of $250
- Opt in using the form to claim your 50% deposit bonus
Learn to Trade
Never Miss A Trade Again

Signal Notification
Real-time signal notifications whenever a signal is opened, closes or Updated

Get Alerts
Immediate alerts to your email and mobile phone.

Entry Price Levels
Entry price level for every signal Just choose one of our Top Brokers in the list above to get all this free.