Monero – Guide, Tips & Insights | Learn 2 Trade (XMR) Price Analysis: March 13
In case the resistance level of $185 holds, ranging movement may continue, below the current price level, support levels may be found at $142, $122 and $102.When the bulls break up the resistance level of $185, there may be an increase towards the resistance level of $216 and $250.
Key Levels:
Resistance Levels: $185, $216, $250
Support Levels: $142, $122, $102
XMRUSD Long-term Trend: Bullish
Monero – Guide, Tips & Insights | Learn 2 Trade is bullish on the daily chart. The price action has formed a double bottom chart pattern on the daily chart. Last week, the price was on ranging movement in the XMR market commenced on January 24 when the price reached the support level of $142 and the bearish momentum failed. On March 08, the bullish pressure increased and broke up the resistance level of $185. It pulled back to retest the dynamic support level. Bullish trend may continue next week.
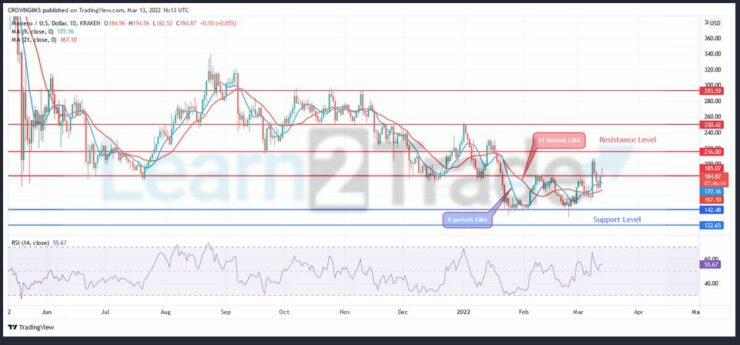
Monero – Guide, Tips & Insights | Learn 2 Trade price is trading above the 9 periods EMA and 21 periods EMA as a sign of bullish market. In case the resistance level of $185 holds, ranging movement may continue, below the current price level, support levels may be found at $142, $122 and $102.When the bulls break up the resistance level of $185, there may be an increase towards the resistance level of $216 and $250. However, the relative strength index period 14 is at 55 levels with the signal line displaying bullish direction.
XMRUSD Price Medium-term Trend: Bullish
Monero – Guide, Tips & Insights | Learn 2 Trade is on the bullish movement on 4-hour chart. The price was range-bound within the resistance level of $185 and support level of $142. The momentum of the bulls become strong enough to break up the resistance level of $185. The price retracement was carried out towards dynamic support level. At the moment, the price is increasing gradually.
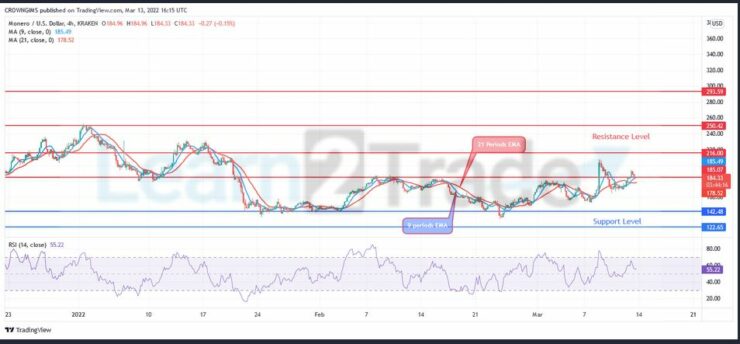
The price is trading above the 9-day EMA and the 21-day EMA which indicate a bullish movement. The relative strength index periods 14 is at 54 levels pointing down to indicate sell signal which may be a pullback.
You can purchase Lucky Block – Guide, Tips & Insights | Learn 2 Trade here. Buy LBlock:
- Broker
- Min Deposit
- Score
- Visit Broker

- Award-winning Cryptocurrency trading platform
- $100 minimum deposit,
- FCA & Cysec regulated

- 20% welcome bonus of upto $10,000
- Minimum deposit $100
- Verify your account before the bonus is credited
- Fund Moneta Markets account with a minimum of $250
- Opt in using the form to claim your 50% deposit bonus
Learn to Trade
Never Miss A Trade Again

Signal Notification
Real-time signal notifications whenever a signal is opened, closes or Updated

Get Alerts
Immediate alerts to your email and mobile phone.

Entry Price Levels
Entry price level for every signal Just choose one of our Top Brokers in the list above to get all this free.