Annual Forecast for Monero – Guide, Tips & Insights | Learn 2 Trade Coin (2022)
In case the support level of $179 holds, bulls may take over the market and the price will increase towards the resistance levels of $220, $249 and $281. When the bears break down the support level of $179, there may be a decrease towards the support level of $161 and $136.
Key Levels:
Resistance Levels: $220, $249, $281
Support Levels: $179, $161, $136
XMRUSD Long-term Trend: Bearish
Monero – Guide, Tips & Insights | Learn 2 Trade is bearish on the weekly chart. Last year, the bullish trend commenced by the bull on January 04 at $136 support level. The bulls’ pressure broke up the resistance levels of $161 and $179 and placed the price at $511 level which is the high of the year. The sellers interrupted the price increase with the formation of bearish engulfing candles. The price decline to test the support level of $179. The just mentioned level happen to be the low of the year.
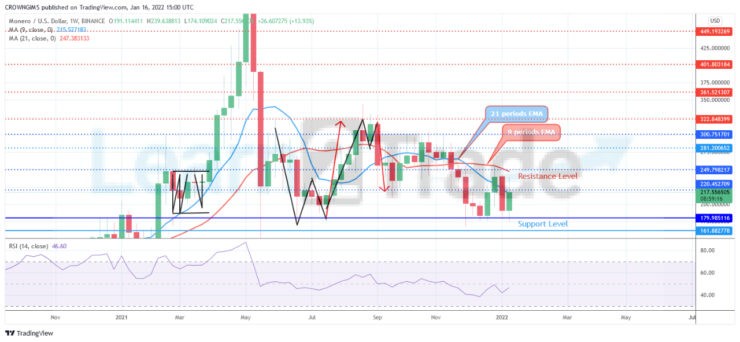
Monero – Guide, Tips & Insights | Learn 2 Trade price is trading below the 9 periods EMA and 21 periods EMA as a sign of bearish momentum. In case the support level of $179 holds, bulls may take over the market and the price will increase towards the resistance levels of $220, $249 and $281. When the bears break down the support level of $179, there may be a decrease towards the support level of $161 and $136. However, the relative strength index period 14 is at 50 levels with the signal line displaying bullish direction.
XMRUSD Price Medium-term Trend: Bullish
Monero – Guide, Tips & Insights | Learn 2 Trade is on the bullish movement on daily chart. The price action on the daily chart has formed a double bottom chart pattern. The first time price tested the support level at $179 was December 15. The price bounced up because the bearish pressure could not break it down. It tested the resistance level of $249. The bears opposed the price increase and push down the price to retest the previous low at $179 on January 08. The bulls may take over the market.
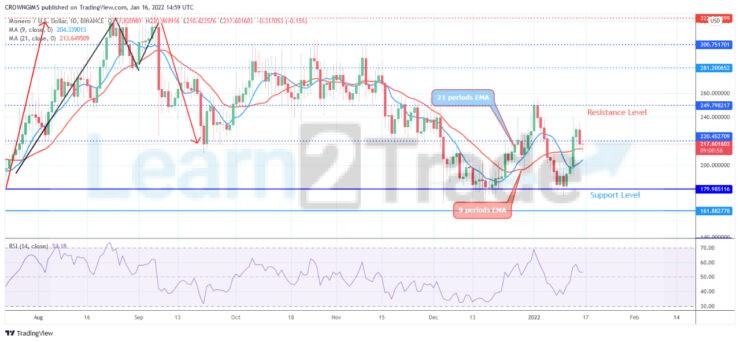
The price is trading above the 9-day EMA and the 21-day EMA which indicate a bullish reversal at $179 level. The relative strength index is at 40 levels pointing down to indicate sell signal which may be a pullback.
You can purchase crypto coins here. Buy Tokens
- Broker
- Min Deposit
- Score
- Visit Broker

- Award-winning Cryptocurrency trading platform
- $100 minimum deposit,
- FCA & Cysec regulated

- 20% welcome bonus of upto $10,000
- Minimum deposit $100
- Verify your account before the bonus is credited
- Fund Moneta Markets account with a minimum of $250
- Opt in using the form to claim your 50% deposit bonus
Learn to Trade
Never Miss A Trade Again

Signal Notification
Real-time signal notifications whenever a signal is opened, closes or Updated

Get Alerts
Immediate alerts to your email and mobile phone.

Entry Price Levels
Entry price level for every signal Just choose one of our Top Brokers in the list above to get all this free.