

Monero (XMR) Price Analysis: June 06
In case there is further increase in the bears’ momentum a breakdown of $244 support level may be experienced, which may drop the price to previous low of $189. The breakup of $322 resistance level will increase Monero price towards $361 levels and beyond
Key Levels:
Resistance Levels: $281, $322, $361
Support Levels: $244, $189, $161
XMRUSD Long-term Trend: Bearish
Monero is bearish on the daily chart. XMR bottomed at support level of $189 on May 19 after a big fall from the May high of $511 resistance level. The bulls reject further price reduction with the formation of daily bullish candle. The price retraced back towards the resistance level of $281. The bullish momentum was opposed at the $322 price level. The price is currently bearish, moving down towards the previous low at $189.
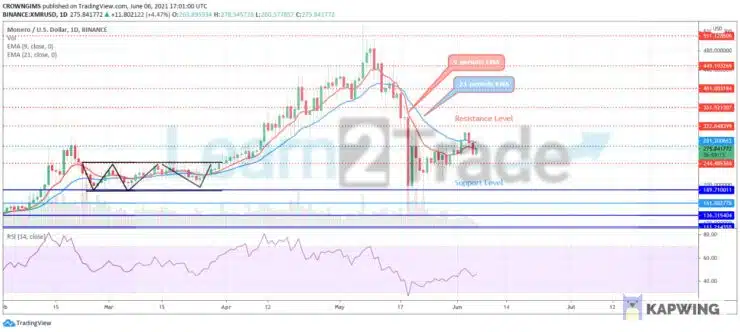
Monero price is trading below the 9 periods EMA and 21 periods EMA at a close contact as a sign of low bearish and bullish momentum. In case there is further increase in the bears’ momentum a breakdown of $244 support level may be experienced, which may drop the price to previous low of $189. The breakup of $322 resistance level will increase Monero price towards $361 levels and beyond. However, the relative strength index period 14 is at 40 levels with the signal line pointing up to indicate a buy signal.
XMRUSD Price Medium-term Trend: Ranging
Monero is on the ranging movement on 4-Hour chart. Ranging movement started last week on the 4-hour chart in the Monero market. The sellers’ pressure could not break down the $244 support level. Likewise, the bulls’ pressure could not break up the $322 resistance level. This is what made ranging movement to continue.

The price is hovering over and around the two EMAs with the 9-day EMA interlocked with the 21-day EMA which indicate that consolidation is in progress. The relative strength index is at 50 levels pointing up to indicate buy signal.


