Monero – Guide, Tips & Insights | Learn 2 Trade (XMR) Price Analysis: January 09
In case the bulls oppose the bearish movement at $179, price may reverse and face the resistance level of $220, which may increase the price to high of $249 and $281. When the bears break down the support level of $179, there may be a decrease towards the support level of $161 and $136.
Key Levels:
Resistance Levels: $220, $249, $281
Support Levels: $179, $161, $136
XMRUSD Long-term Trend: Bearish
Monero – Guide, Tips & Insights | Learn 2 Trade is bearish on the daily chart. The bullish trend commenced by the bull on December 20 at $179 support level place the price at $249 level. The bulls’ pressure failed and could not break up the resistance level. An inside bar candle pattern formed and the price decline to test the previous low after broke down the $220 level. The price is testing $179 level at the moment and the bulls dominate the market today which may increase the price.
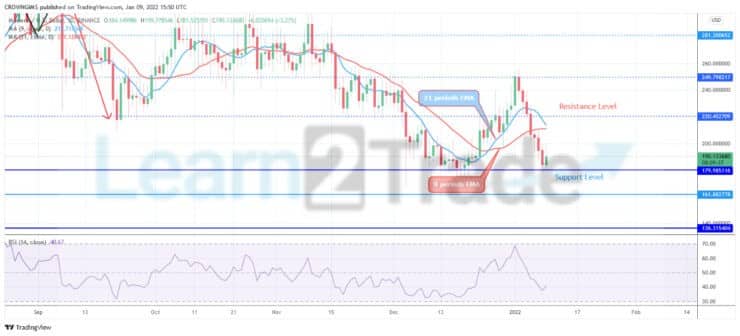
Monero – Guide, Tips & Insights | Learn 2 Trade price is trading below the 9 periods EMA and 21 periods EMA as a sign of bearish momentum. In case the bulls oppose the bearish movement at $179, price may reverse and face the resistance level of $220, which may increase the price to high of $249 and $281. When the bears break down the support level of $179, there may be a decrease towards the support level of $161 and $136. However, the relative strength index period 14 is at 40 levels with the signal line displaying bullish direction.
XMRUSD Price Medium-term Trend: Bearish
Monero – Guide, Tips & Insights | Learn 2 Trade is on the bearish movement on 4-Hour chart. The price action on the 4-hour chart is trying to form a double bottom chart pattern. The price tested the support level at $179 on December 15. The mentioned level holds and the price bounced up and test the resistance level of $249. The bears opposed the price increase and push down the price towards the previous low at $179. It seems the bulls are getting ready to take over the market.
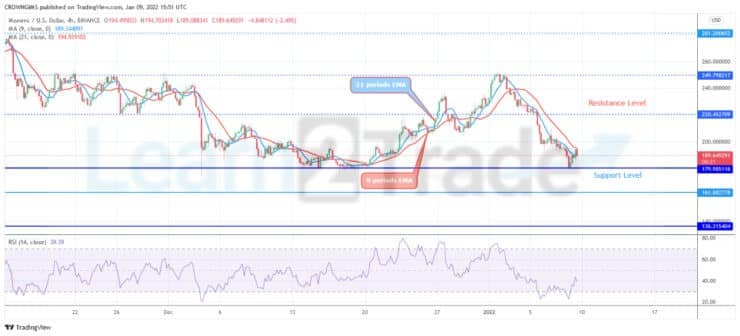
The price is trading between the 9-day EMA and the 21-day EMA which may indicate a bullish reversal at $179 level. The relative strength index is at 40 levels pointing up to indicate buy signal.
You can purchase crypto coins here. Buy Tokens
- Broker
- Min Deposit
- Score
- Visit Broker

- Award-winning Cryptocurrency trading platform
- $100 minimum deposit,
- FCA & Cysec regulated

- 20% welcome bonus of upto $10,000
- Minimum deposit $100
- Verify your account before the bonus is credited
- Fund Moneta Markets account with a minimum of $250
- Opt in using the form to claim your 50% deposit bonus
Learn to Trade
Never Miss A Trade Again

Signal Notification
Real-time signal notifications whenever a signal is opened, closes or Updated

Get Alerts
Immediate alerts to your email and mobile phone.

Entry Price Levels
Entry price level for every signal Just choose one of our Top Brokers in the list above to get all this free.