Monero – Guide, Tips & Insights | Learn 2 Trade (XMR) Price Analysis: January 30
Should the support level of $136 holds, the price will increase towards the resistance levels of $161, $179 and $220. When the bears increase their pressure, there may be a decrease towards the support level of $131, $111 and $97
Key Levels:
Resistance Levels: $161, $179, $220
Support Levels: $136, $111, $97
XMRUSD Long-term Trend: Ranging
Monero – Guide, Tips & Insights | Learn 2 Trade is bearish on the daily chart. The bullish movement could not break up the resistance level of $220 after the price retracement. A Bearish engulfing candle formed at $220 level which interrupted the bulls’ momentum. This scenario triggered sellers’ pressure and the price broke down the support levels of $179 and $161. The support level of $136 is tested on January, since then the price is ranging around the support level of $136.
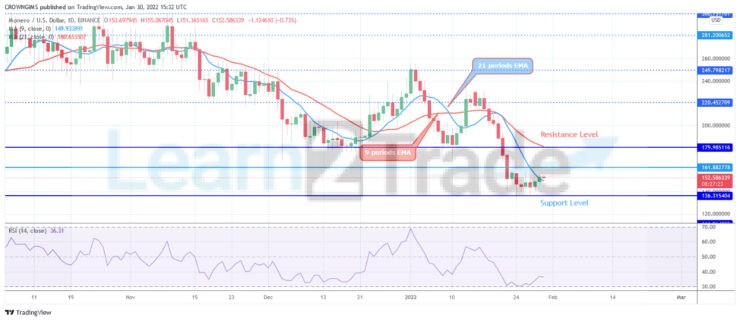
Monero – Guide, Tips & Insights | Learn 2 Trade price is trading above the 9 periods EMA but below the 21 periods EMA as an indication that bulls are getting ready to take over the Monero – Guide, Tips & Insights | Learn 2 Trade market. Should the support level of $136 holds, the price will increase towards the resistance levels of $161, $179 and $220. When the bears increase their pressure, there may be a decrease towards the support level of $131, $111 and $97. However, the relative strength index period 14 is at 40 levels with the signal line displaying bullish direction.
XMRUSD Price Medium-term Trend: Ranging
Monero – Guide, Tips & Insights | Learn 2 Trade is on the ranging movement on daily chart. The price is ranging within the $161 and $136 price levels at the moment. The bulls were unable to break up the resistance level of $220 after the formation of double bottom chart pattern. The price declined and tested the support level of $136. Bulls’ and bears’ momentum became weak and ranging movement commenced.
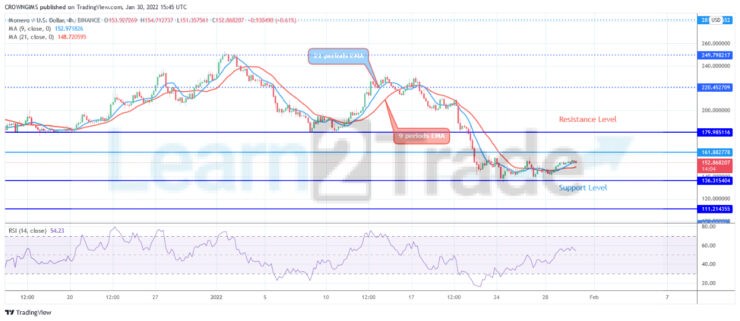
The price is trading around the 9-day EMA and the 21-day EMA which indicate a ranging movement. The relative strength index is above 50 levels pointing up to indicate buy signal which may be the beginning of bullish trend.
You can purchase crypto coins here. Buy Tokens
- Broker
- Min Deposit
- Score
- Visit Broker

- Award-winning Cryptocurrency trading platform
- $100 minimum deposit,
- FCA & Cysec regulated

- 20% welcome bonus of upto $10,000
- Minimum deposit $100
- Verify your account before the bonus is credited
- Fund Moneta Markets account with a minimum of $250
- Opt in using the form to claim your 50% deposit bonus
Learn to Trade
Never Miss A Trade Again

Signal Notification
Real-time signal notifications whenever a signal is opened, closes or Updated

Get Alerts
Immediate alerts to your email and mobile phone.

Entry Price Levels
Entry price level for every signal Just choose one of our Top Brokers in the list above to get all this free.