
Monero – Guide, Tips & Insights | Learn 2 Trade (XMR) Price Analysis: May 16
Should the bears continue to increase their momentum, $361 support level will be broken down side, and Monero – Guide, Tips & Insights | Learn 2 Trade will decrease towards $322 and $281 levels. Inability to break down the $361 level, the price may increase towards the $401, $449 and $511 resistance levels.
Key Levels:
Resistance Levels: $401, $449, $511
Support Levels: $361, $322, $281
XMRUSD Long-term Trend: Bearish
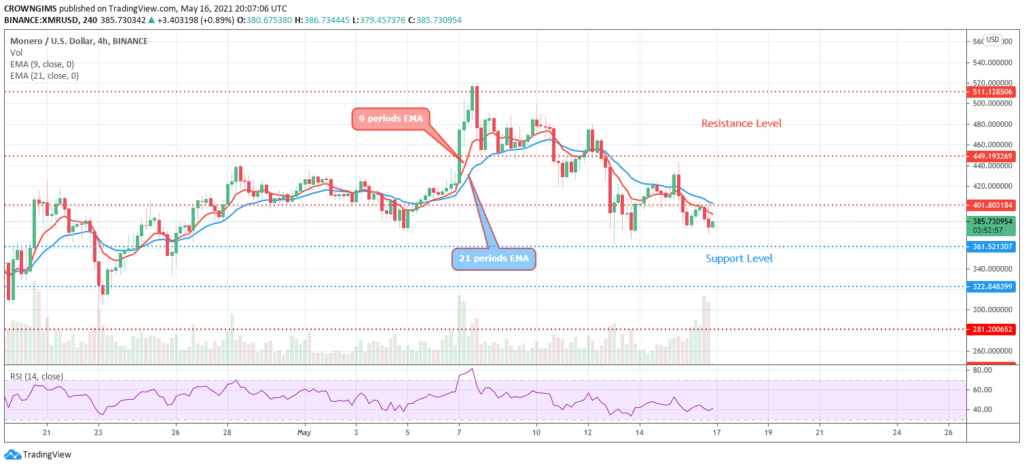
Monero – Guide, Tips & Insights | Learn 2 Trade is bearish on the daily chart. The bulls were in control of the Monero – Guide, Tips & Insights | Learn 2 Trade market for over two weeks ago. The bullish momentum has pushed up the price to the resistance level of $511 on May 10. A bearish engulfing candle emerges, which is a bearish chart pattern. The price obeyed the command and follow the direction of the bears.

Monero – Guide, Tips & Insights | Learn 2 Trade price breaks down the support levels of $449 and $401 declining towards the support level of $361. It is trading below the 9 periods EMA and 21 periods EMA at a distance as a sign of bearish movement. Should the bears continue to increase their momentum, $361 support level will be broken down side, and Monero – Guide, Tips & Insights | Learn 2 Trade will decrease towards $322 and $281 levels. Inability to break down the $361 level, the price may increase towards the $401, $449 and $511 resistance levels. However, the relative strength index period 14 is at 40 levels with the signal line pointing down to indicate sell signal.
XMRUSD Price Medium-term Trend: Bearish
Monero – Guide, Tips & Insights | Learn 2 Trade is on the bearish movement on 4-Hour chart. The buyers’ pressure failed when it tested the resistance level of $449. A bearish engulfing candle formed and the price decline towards the support level of $361 after it penetrates the $401 level.

The price is trading below the two EMAs with the 9-day EMA below the 21-day EMA which indicate a bearish movement. The relative strength index is at $40 levels pointing down to indicate sell signal.
You can purchase crypto coins here: Buy coins
- Broker
- Min Deposit
- Score
- Visit Broker

- Award-winning Cryptocurrency trading platform
- $100 minimum deposit,
- FCA & Cysec regulated

- 20% welcome bonus of upto $10,000
- Minimum deposit $100
- Verify your account before the bonus is credited


- Fund Moneta Markets account with a minimum of $250
- Opt in using the form to claim your 50% deposit bonus


