Lucky Block – Guide, Tips & Insights | Learn 2 Trade price forecast is preparing for a renewed bullish push, following a corrective dip toward the $0.00001260 market zone.
Daily Chart Key Levels:
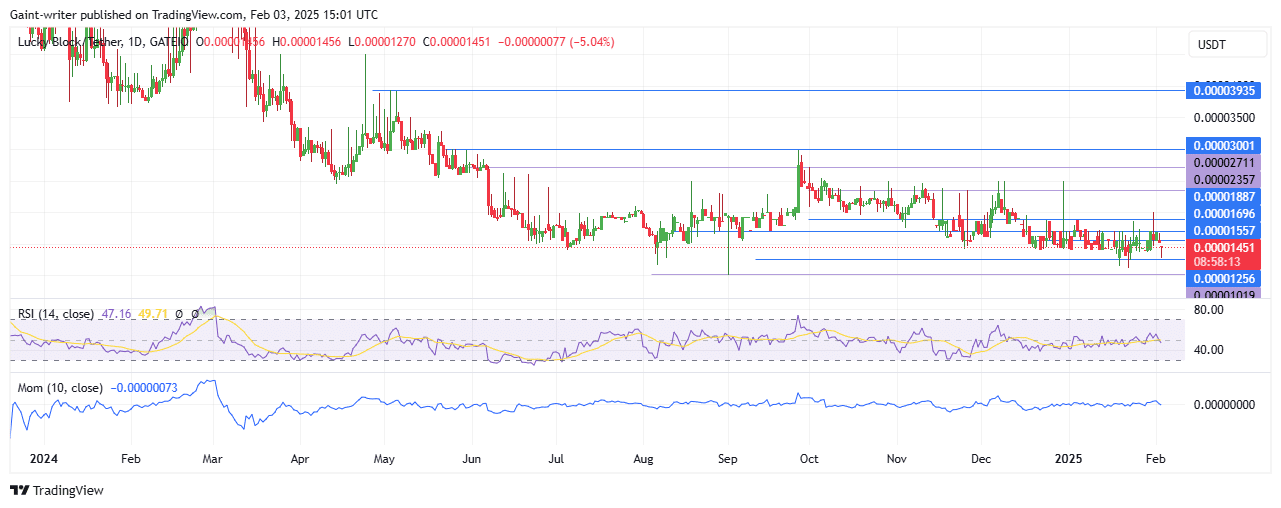
Support Levels: $0.00001260, $0.00001450, $0.00001430
The market opened the week at $0.00001450, but buyers are regaining strength. This has set the stage for a potential breakout back toward the $0.00001690 key level. After facing strong bullish pressure last week, the market retraced lower to build momentum for its next rally. Now, buyers are aiming for an aggressive rebound, which could result in a larger upward move in the coming sessions.
Lucky Block – Guide, Tips & Insights | Learn 2 Trade is showing early signs of a bullish resurgence, with buyers looking to capitalise on the recent dip. The RSI (Relative Strength Index) remains in the mid-zone, suggesting that buyers still have the potential to take control.
.
The Momentum indicator initially declined at the start of the week, but a revival could trigger a significant rally. If buyers successfully regain momentum, LBLOCKUSD could target $0.00001690 and potentially extend toward the $0.00002000 level.
.
A confirmed push above $0.00001690 would reinforce bullish dominance, opening the door for further expansion. If momentum remains weak, buyers may first consolidate between the $0.00001450 and $0.00001690 zones before another attempt higher. A break below the $0.00001260 market area could delay a bullish recovery. This may lead to further consolidation before the next surge.
Lucky Block – Guide, Tips & Insights | Learn 2 Trade Medium Term Trend: Bullish (4-hour Chart)
In the shorter time frame, Lucky Block – Guide, Tips & Insights | Learn 2 Trade is showing clear signs of buyers re-entering the market. The RSI is stabilising, indicating that buy-side pressure is building.
.
The Momentum indicator is showing early signs of revival, suggesting that a strong push could be imminent. Volatility is increasing, signalling that a breakout may occur soon.
If buyers maintain control, LBLOCKUSD could quickly retest $0.00001690 zones. This means there will be further gains toward $0.00002000 possible in the short term.
Note: Learn2.trade is not a financial advisor. Do your research before investing your funds in any financial asset, product, or event. We are not responsible for your investment results.
Trade on MT4 with Leverage up to 1:500! Trade on MT4 with Leverage up to 1:500!
X
We use cookies to ensure that we give you the best experience on our website. If you continue to use this site we will assume that you are happy with it.

 Lucky Block – Guide, Tips & Insights | Learn 2 Trade Medium Term Trend: Bullish (4-hour Chart)
 Lucky Block – Guide, Tips & Insights | Learn 2 Trade Medium Term Trend: Bullish (4-hour Chart)


