The Lucky Block – Guide, Tips & Insights | Learn 2 Trade price forecast is preparing for another potential expansion. The token price is closing the gap after days of effort.
LBLOCKUSD Key Levels
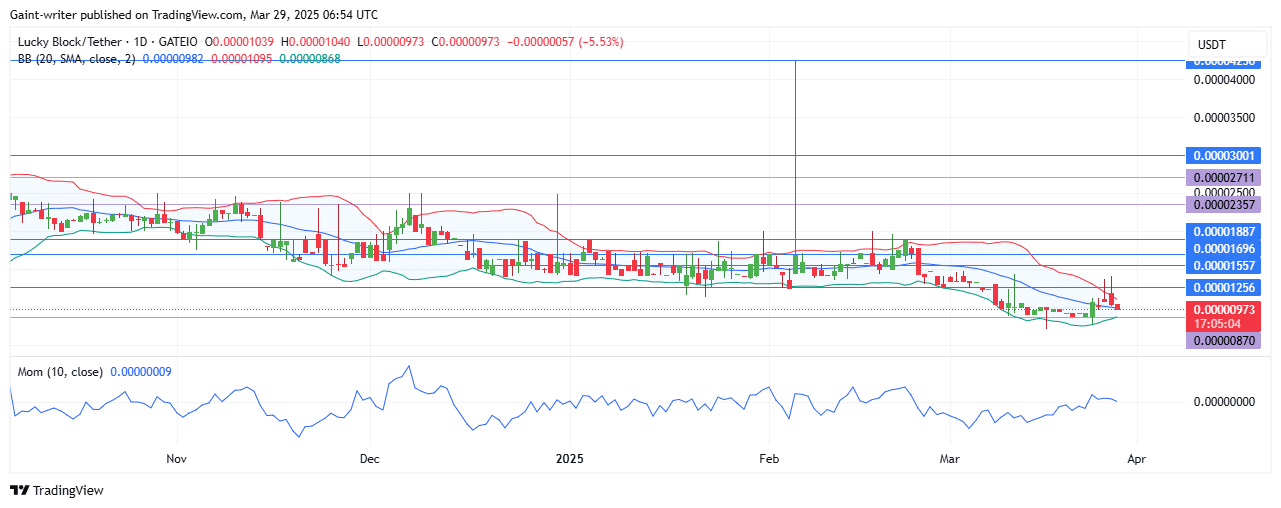
Support Level: $0.00000860, $0.00000980 Resistance Level: $0.00001890 , $0.00001920
Lucky Block – Guide, Tips & Insights | Learn 2 Trade Long Term Trend: Bullish (Daily Chart)
Recently, the price has seen a buildup from the $0.00000860 key level up to the current zone around $0.00001260. Since February, sellers have exerted control over the market, creating a challenging environment for buyers.
Despite the bulls’ efforts, they have struggled to break through the significant resistance level at $0.00001890. Recently, Lucky Block – Guide, Tips & Insights | Learn 2 Trade broke out of its consolidation phase, leading to a pullback as sellers took prices lower.
However, sellers are now gaining attention as buyers prepare for another potential expansion. The Bollinger Bands indicate a tightening of price action, suggesting that a breakout may soon occur as the market compacts.
The Momentum indicator remains in the mid-range, indicating a potential for upward movement. On the short time frame, buyers are actively looking for a breakout, and the Bollinger Band indicator supports this buildup, signaling that volatility may soon increase.
LBLOCK Medium-Term Trend: Bullish (4-hour chart)
The outlook for LBLOCKUSD suggests that the market is preparing for an expansion as buyers seek to capitalise on the current dynamics. If the buildup continues, a breakout beyond the $0.00001260 resistance could set the stage for further gains.
Traders should closely monitor the behaviour of the Momentum indicator and Bollinger Bands for signs of potential breakout points. A successful push above the $0.00001260 level may pave the way for a new wave of bullish activity.
Note: Learn2.trade is not a financial advisor. Do your research before investing your funds in any financial asset, product, or event. We are not responsible for your investment results.
Trade on MT4 with Leverage up to 1:500! Trade on MT4 with Leverage up to 1:500!
X
We use cookies to ensure that we give you the best experience on our website. If you continue to use this site we will assume that you are happy with it.