Don’t invest unless you’re prepared to lose all the money you invest. This is a high-risk investment and you are unlikely to be protected if something goes wrong. Take 2 minutes to learn more
Lucky Block – Guide, Tips & Insights | Learn 2 Trade Price Forecast – Expert Analysis & Trading Tips | Learn 2 Trade – Expert Analysis & Trading Tips | Learn 2 Trade – July 26th
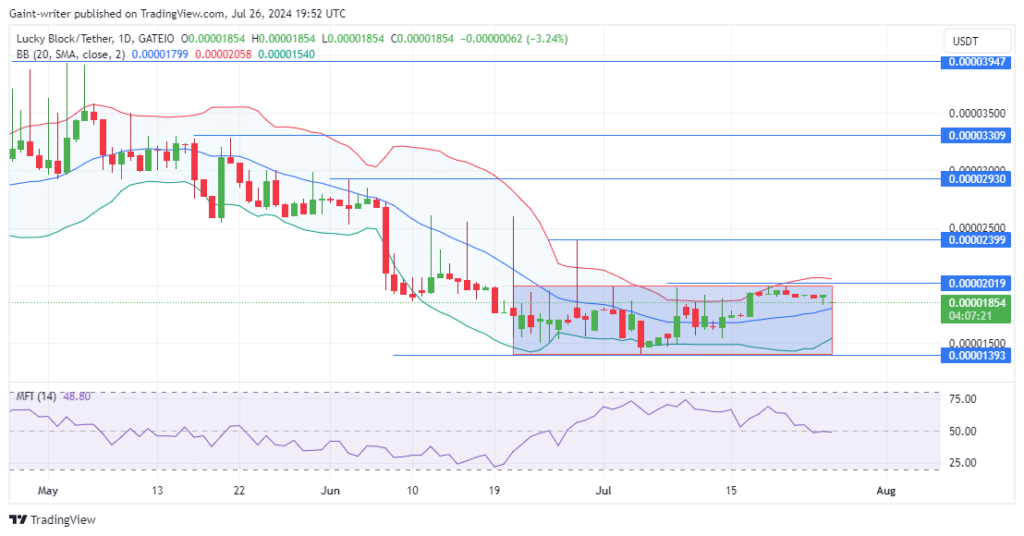
Lucky Block – Guide, Tips & Insights | Learn 2 Trade price forecast shows the token has been consolidating after a prolonged bearish streak, with buyers aiming to break above the crucial $0.00002000 price zone.
LBLOCKUSD Long Term Trend: Bullish (1-Day Chart)
Key Levels
Support Zones: $0.000019910, $0.000013700
Resistance Zones: $0.00003310, $0.00002000
Lucky Block – Guide, Tips & Insights | Learn 2 Trade Price Forecast – Expert Analysis & Trading Tips | Learn 2 Trade – Expert Analysis & Trading Tips | Learn 2 Trade – LBLOCKUSD Outlook
The bearish trend that plagued LBLOCKUSD for a significant time can be traced back to the first quarter of the year when the token experienced a sharp decline from the $0.00003900 key level. This selling pressure pushed the price down to the $0.00001390 critical support area, which has since served as a crucial floor for the buyers.
Despite relentless bearish pressure, LBLOCKUSD buyers have maintained their confidence. They have been actively trying to build up their strength during the recent consolidation phase. The token has been trading within a tight range as market participants await a clear catalyst that could trigger a breakout in either direction.
The buyers’ primary objective is to breach the $0.00002000 price zone, which has emerged as a crucial level of resistance. A successful breach of this level could pave the way for a strong bullish reversal, allowing the LBLOCKUSD price to regain its upward momentum and potentially target higher levels. The Money Flow Index has yet to put the buyers in a bullish position, and the Bollinger Bands still show volatility in the market.
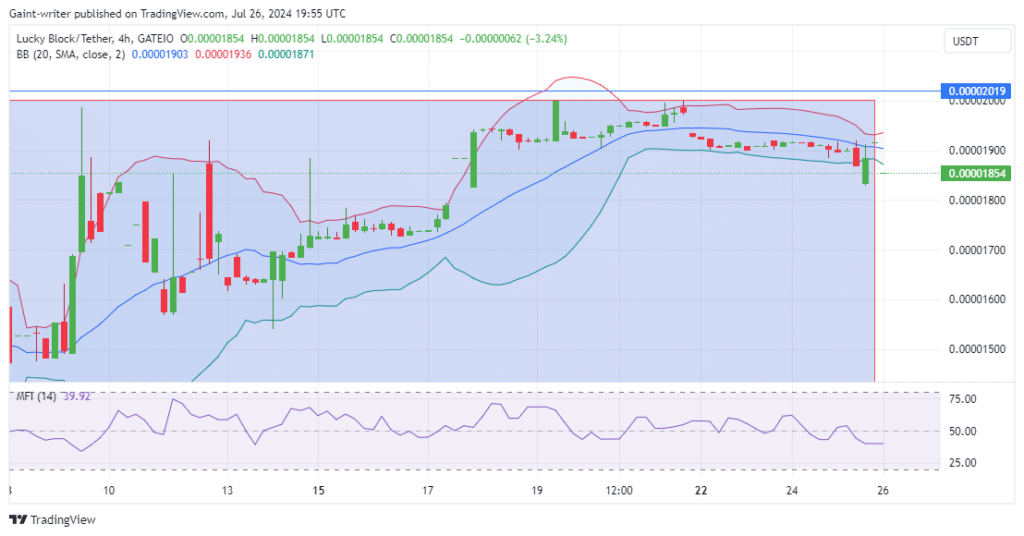
Lucky Block – Guide, Tips & Insights | Learn 2 Trade Medium Term Trend – Bullish (4-hour)
The consolidation pattern observed in the LBLOCKUSD market is typical of a market in transition, with buyers and sellers currently engaged in a tug-of-war.
How To Buy Lucky Block – Guide, Tips & Insights | Learn 2 Trade
Note: Learn2.trade is not a financial advisor. Do your research before investing your funds in any financial asset, product, or event. We are not responsible for your investment results.
- Broker
- Min Deposit
- Score
- Visit Broker
- Award-winning Cryptocurrency trading platform
- $100 minimum deposit,
- FCA & Cysec regulated
- 20% welcome bonus of upto $10,000
- Minimum deposit $100
- Verify your account before the bonus is credited
- Fund Moneta Markets account with a minimum of $250
- Opt in using the form to claim your 50% deposit bonus
Learn to Trade
Never Miss A Trade Again

Signal Notification
Real-time signal notifications whenever a signal is opened, closes or Updated

Get Alerts
Immediate alerts to your email and mobile phone.

Entry Price Levels
Entry price level for every signal Just choose one of our Top Brokers in the list above to get all this free.


