Lucky Block price forecast shows buyers are gradually gaining momentum, aiming to break out of consolidation and push toward the $0.00001880 resistance level.
LBLOCK Key Levels:
Support Levels: $0.00001250, $0.00001500, $0.00001460 Resistance Levels: $0.00001880, $0.00004000, $0.00001200
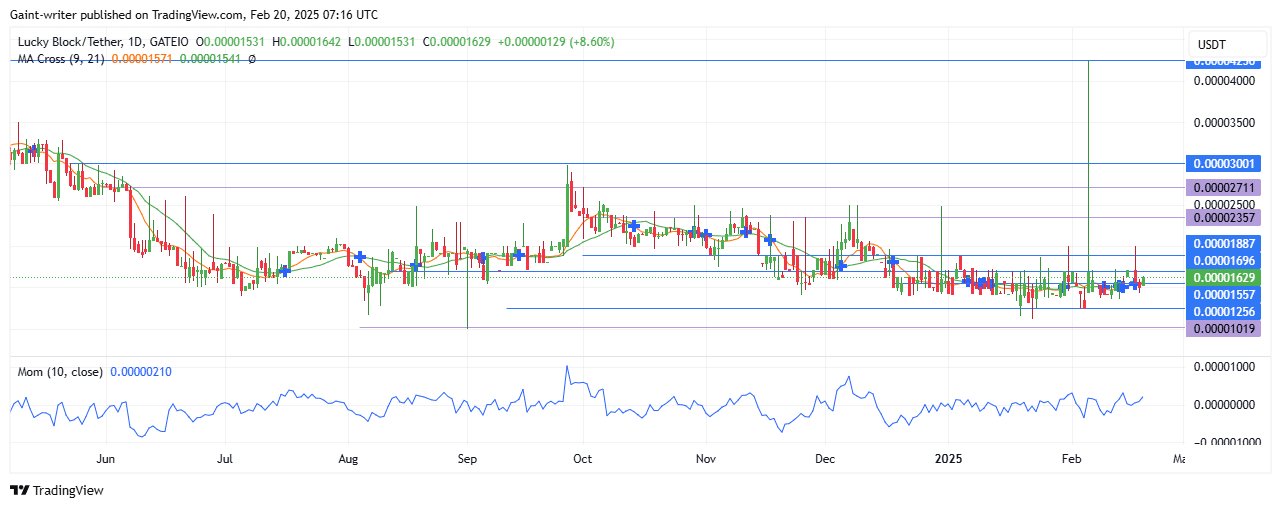
Lucky Block has remained range-bound, with price action oscillating between $0.00001250 and $0.00001880. Earlier this year, sellers attempted to push lower, but buy pressure halted further declines at the $0.00001250 support level.
Bulls took control, driving the price up to $0.00004000, but momentum has since slowed. If buyers can maintain their stance, another bullish attempt to break $0.00001880 key area is likely in the coming days.
The Momentum Indicator remains steady, showing that buyers are still accumulating strength. However, a clear bullish breakout will require confirmation from the Moving Average Cross indicator. For now the MA is yet to give a strong buy signal.
Lucky Block’s bullish consolidation suggests that buyers are preparing for a breakout. If momentum strengthens, we could see a push toward $0.00001880 and beyond. However, failure to break out of consolidation may lead to a temporary pullback to $0.00001500 before another bullish attempt.
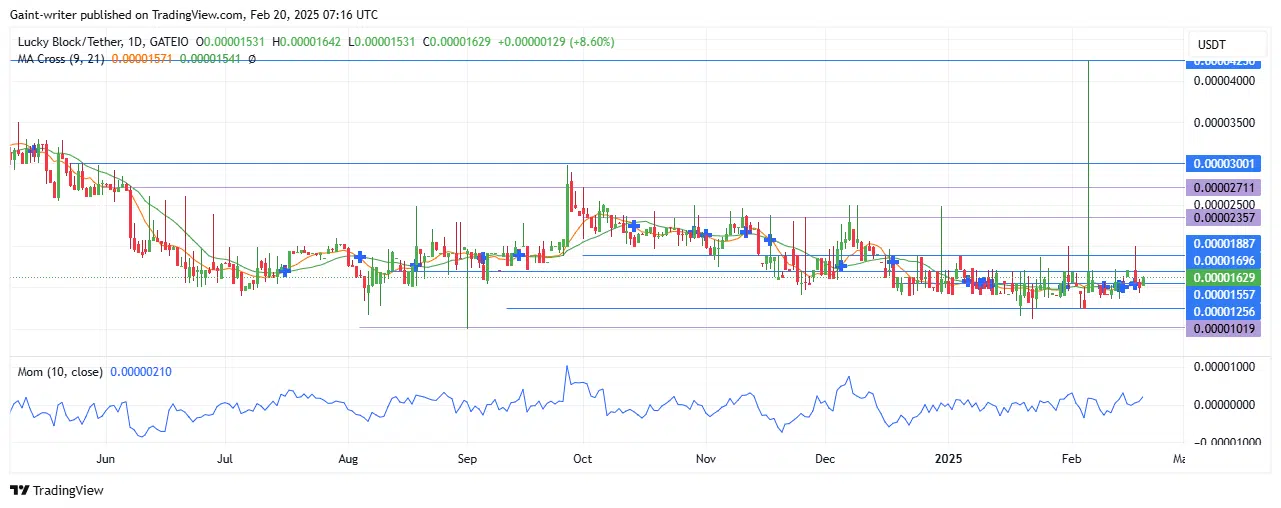
On the 4-hour chart, buyers are showing signs of strength, with price action gradually tilting upward. The Momentum Indicator suggests growing confidence, though a breakout confirmation is still needed.
Note: Learn2.trade is not a financial advisor. Do your research before investing your funds in any financial asset, product, or event. We are not responsible for your investment results.
We use cookies to ensure that we give you the best experience on our website. If you continue to use this site we will assume that you are happy with it.


 Lucky Block Medium-Term Trend: Bullish (4-Hour Chart)


