Don’t invest unless you’re prepared to lose all the money you invest. This is a high-risk investment and you are unlikely to be protected if something goes wrong. Take 2 minutes to learn more
Lucky Block – Guide, Tips & Insights | Learn 2 Trade Price Forecast – Expert Analysis & Trading Tips | Learn 2 Trade – Expert Analysis & Trading Tips | Learn 2 Trade – January 2
Lucky Block – Guide, Tips & Insights | Learn 2 Trade price forecast indicates that buyers are firmly holding their ground as the new year begins, steadily advancing through key levels and asserting dominance in the market.
Lucky Block – Guide, Tips & Insights | Learn 2 Trade Long-Term Trend: Bullish (Daily Chart)
Key Levels
Support Levels: $0.00001390, $0.00001250
Resistance Levels: $0.00001690, $0.00001850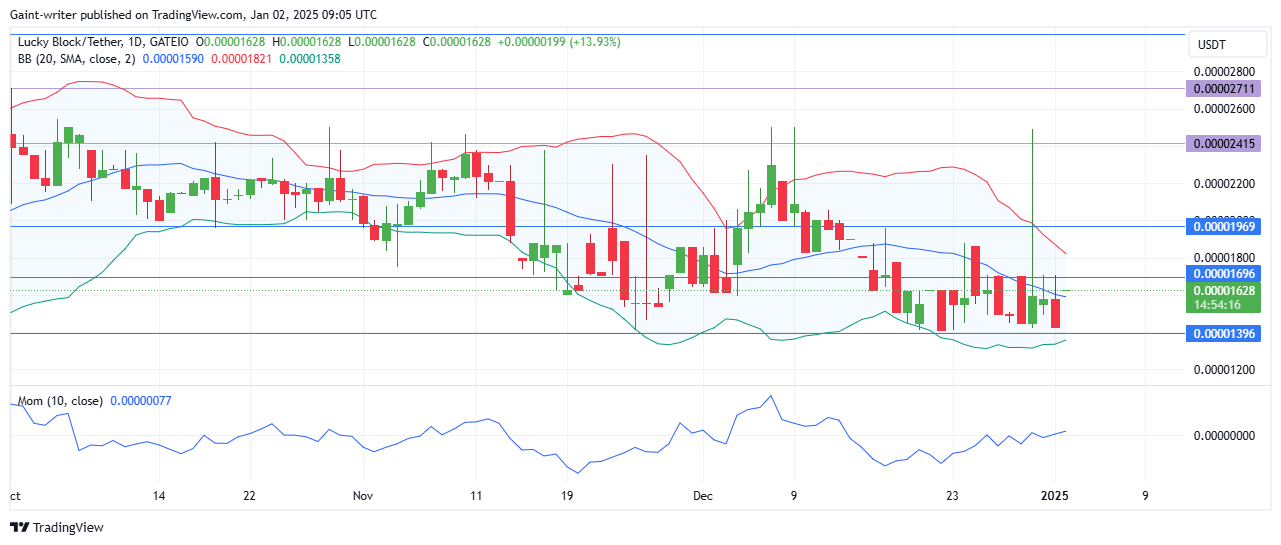 Lucky Block – Guide, Tips & Insights | Learn 2 Trade buyers have shown resilience after a period of consolidation. Following a pullback to the $0.00001390 support level, the bulls have regained control, applying pressure on sellers and sustaining their market dominance.
Lucky Block – Guide, Tips & Insights | Learn 2 Trade Price Forecast – Expert Analysis & Trading Tips | Learn 2 Trade – Expert Analysis & Trading Tips | Learn 2 Trade – LBLOCKUSD Outlook
A significant price spike this week exceeded the Bollinger Band indicator width, highlighting increased volatility and strong bullish intent. Such spikes often reflect heightened trading activity and growing investor confidence, which attract more participants to the market. This shift in momentum could strengthen bullish sentiment further as traders aim to capitalize on upward movements.
The Momentum indicator is showing consistent growth, confirming increased buying activity and suggesting a continuation of the bullish trend. If buyers sustain their aggressive stance, Lucky Block – Guide, Tips & Insights | Learn 2 Trade is likely to surpass the $0.00001690 resistance level. A successful breakout could pave the way for a rally toward $0.00001850 and potentially higher levels, as bullish momentum gains strength.
Conversely, if sellers regain control, the market might retrace to the $0.00001390 support level before attempting another recovery. Traders should monitor the Momentum indicator and the Bollinger Band breakout for confirmation of sustained bullish strength.
Lucky Block – Guide, Tips & Insights | Learn 2 Trade Medium-Term Trend: Bullish (4-hour Chart)
On shorter timeframes, buyers remain proactive, maintaining a steady flow of activity in anticipation of a breakout. The Momentum indicator continues its upward trajectory, reflecting robust buyer engagement.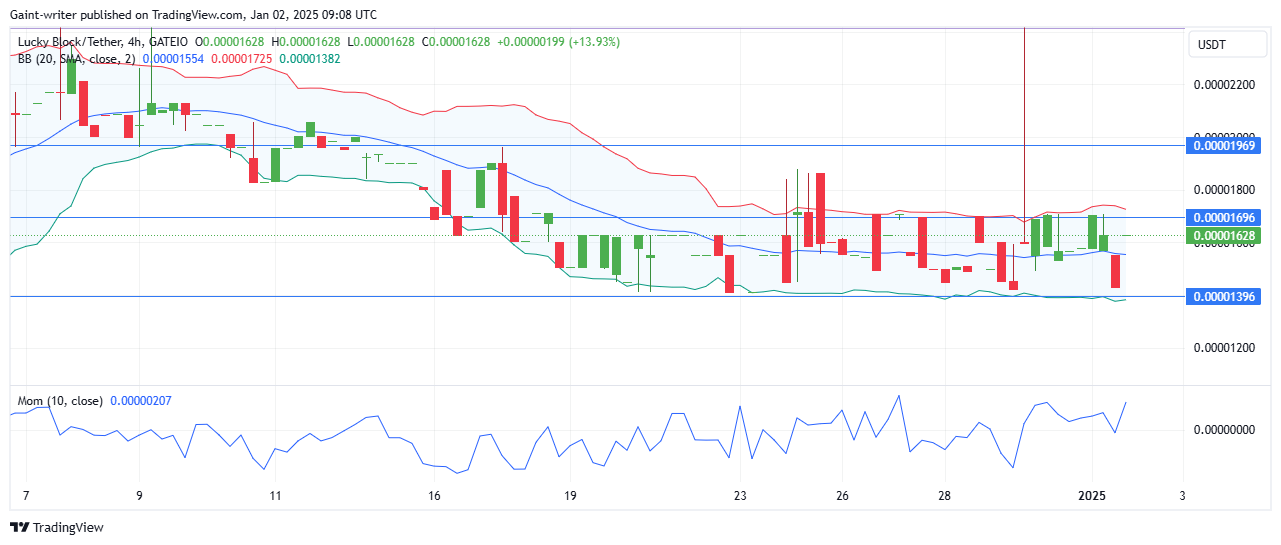 The Bollinger Band on the 4-hour chart is tightening, signaling an imminent breakout. Should bullish orders persist, Lucky Block – Guide, Tips & Insights | Learn 2 Trade could target $0.00001750 in the medium term. However, a temporary consolidation around $0.00001550 may occur if the current momentum falters before another bullish attempt takes place. By utilizing crypto signals effectively, traders can navigate these movements with greater precision.
How To Buy Lucky Block – Guide, Tips & Insights | Learn 2 Trade
Note: Learn2.trade is not a financial advisor. Do your research before investing your funds in any financial asset, product, or event. We are not responsible for your investment results.
- Broker
- Min Deposit
- Score
- Visit Broker

- Award-winning Cryptocurrency trading platform
- $100 minimum deposit,
- FCA & Cysec regulated

- 20% welcome bonus of upto $10,000
- Minimum deposit $100
- Verify your account before the bonus is credited
- Fund Moneta Markets account with a minimum of $250
- Opt in using the form to claim your 50% deposit bonus
Learn to Trade
Never Miss A Trade Again

Signal Notification
Real-time signal notifications whenever a signal is opened, closes or Updated

Get Alerts
Immediate alerts to your email and mobile phone.

Entry Price Levels
Entry price level for every signal Just choose one of our Top Brokers in the list above to get all this free.