Don’t invest unless you’re prepared to lose all the money you invest. This is a high-risk investment and you are unlikely to be protected if something goes wrong. Take 2 minutes to learn more
Lucky Block – Guide, Tips & Insights | Learn 2 Trade Price Forecast – Expert Analysis & Trading Tips | Learn 2 Trade – Expert Analysis & Trading Tips | Learn 2 Trade – January 15th
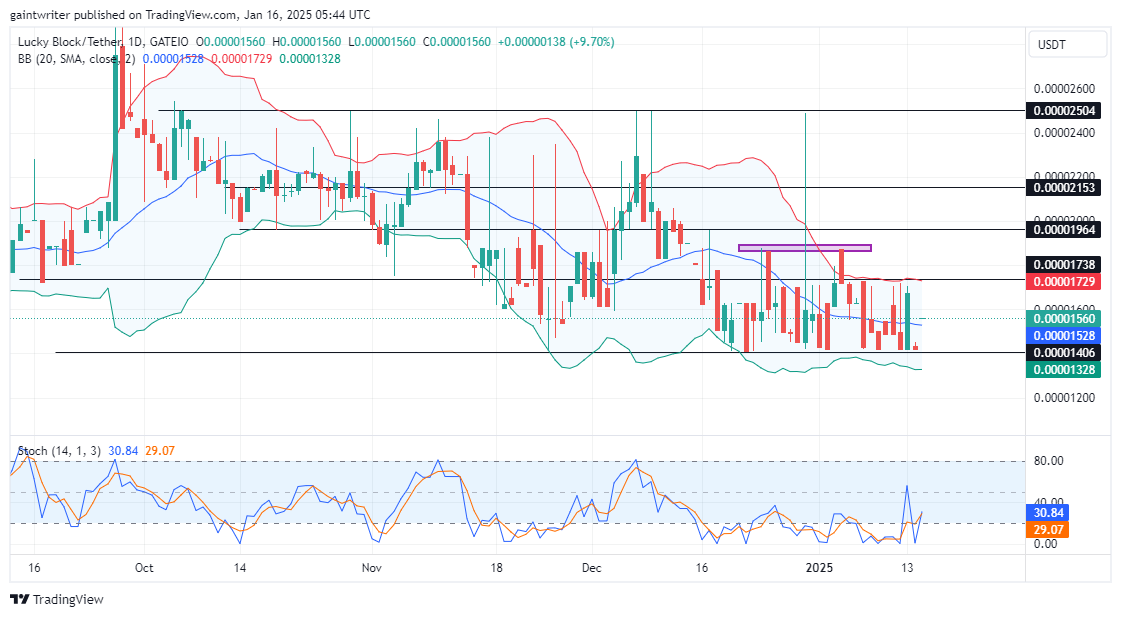
Lucky Block – Guide, Tips & Insights | Learn 2 Trade price forecast shows the bulls are demonstrating promising strength as they approach the critical resistance level of $0.00001730.
 Lucky Block – Guide, Tips & Insights | Learn 2 Trade Long Term Trend: Bullish (Daily Chart) Key Levels
 Lucky Block – Guide, Tips & Insights | Learn 2 Trade Long Term Trend: Bullish (Daily Chart) Key Levels
Support Levels: $0.00001400, $0.00001250 $0.00001320
Resistance Levels: $0.00001730, $0.00002000, $0.00001960
The daily chart reveals that buyers have been pressing harder against sellers this week, marking a notable shift in dynamics. While the previous week saw less activity from buyers, selling pressure was only able to push prices down to the $0.00001400 level. This action demonstrates resilience from the bulls.
Lucky Block – Guide, Tips & Insights | Learn 2 Trade Price Forecast – Expert Analysis & Trading Tips | Learn 2 Trade – Expert Analysis & Trading Tips | Learn 2 Trade – LBLOCKUSD Outlook
Earlier this month, Lucky Block – Guide, Tips & Insights | Learn 2 Trade experienced a downturn, with prices falling from the significant resistance zone of $0.00002500. However, recent activity suggests that bulls are recovering. Furthermore, there is increasing optimism about future price movements as more investors enter the market.
Market volatility remains strong, as indicated by the Bollinger Bands. The widening of these bands signifies heightened volatility, which could lead to significant price movements. The Stochastic Oscillator is also preparing to signal increased buying interest. It suggest that buyers are gearing up for a more substantial engagement in the market.
A solid rise in price from this point could confirm that buyers are gaining traction and increasing their presence in the market. The outlook remains optimistic, and traders should keep an eye on key resistance levels as momentum builds.
Lucky Block – Guide, Tips & Insights | Learn 2 Trade Medium Term Trend: Bullish (4-hour chart)
 Lucky Block – Guide, Tips & Insights | Learn 2 Trade Medium Term Trend: Bullish (4-hour chart)
On the shorter time frames, buyers continue to hint at pushing higher. Despite the current ranging market conditions, the Stochastic Oscillator indicates a growing need for upward movement.
Buy traders can look forward to potential expansion in the coming days. If buyers can successfully break through the $0.00001730 resistance level, it could open the door for further upward momentum.
Note: Learn2.trade is not a financial advisor. Do your research before investing your funds in any financial asset, product, or event. We are not responsible for your investment results.
- Broker
- Min Deposit
- Score
- Visit Broker

- Award-winning Cryptocurrency trading platform
- $100 minimum deposit,
- FCA & Cysec regulated
9.8

- 20% welcome bonus of upto $10,000
- Minimum deposit $100
- Verify your account before the bonus is credited
9
- Fund Moneta Markets account with a minimum of $250
- Opt in using the form to claim your 50% deposit bonus
9
Learn to Trade
Never Miss A Trade Again

step 1
Signal Notification
Real-time signal notifications whenever a signal is opened, closes or Updated

step 2
Get Alerts
Immediate alerts to your email and mobile phone.

step 3
Entry Price Levels
Entry price level for every signal Just choose one of our Top Brokers in the list above to get all this free.