Lucky Block – Guide, Tips & Insights | Learn 2 Trade Price Forecast – Expert Analysis & Trading Tips | Learn 2 Trade – Expert Analysis & Trading Tips | Learn 2 Trade: June 15
The Lucky Block – Guide, Tips & Insights | Learn 2 Trade price forecast calls for new highs above $0.00100
LBLOCK/USD Long-Term Trend: Bullish (30-Minute Chart)
Key Levels:
Supply Zones: $0.001700, $0.001450
Demand Zones: $0.001000, $0.000760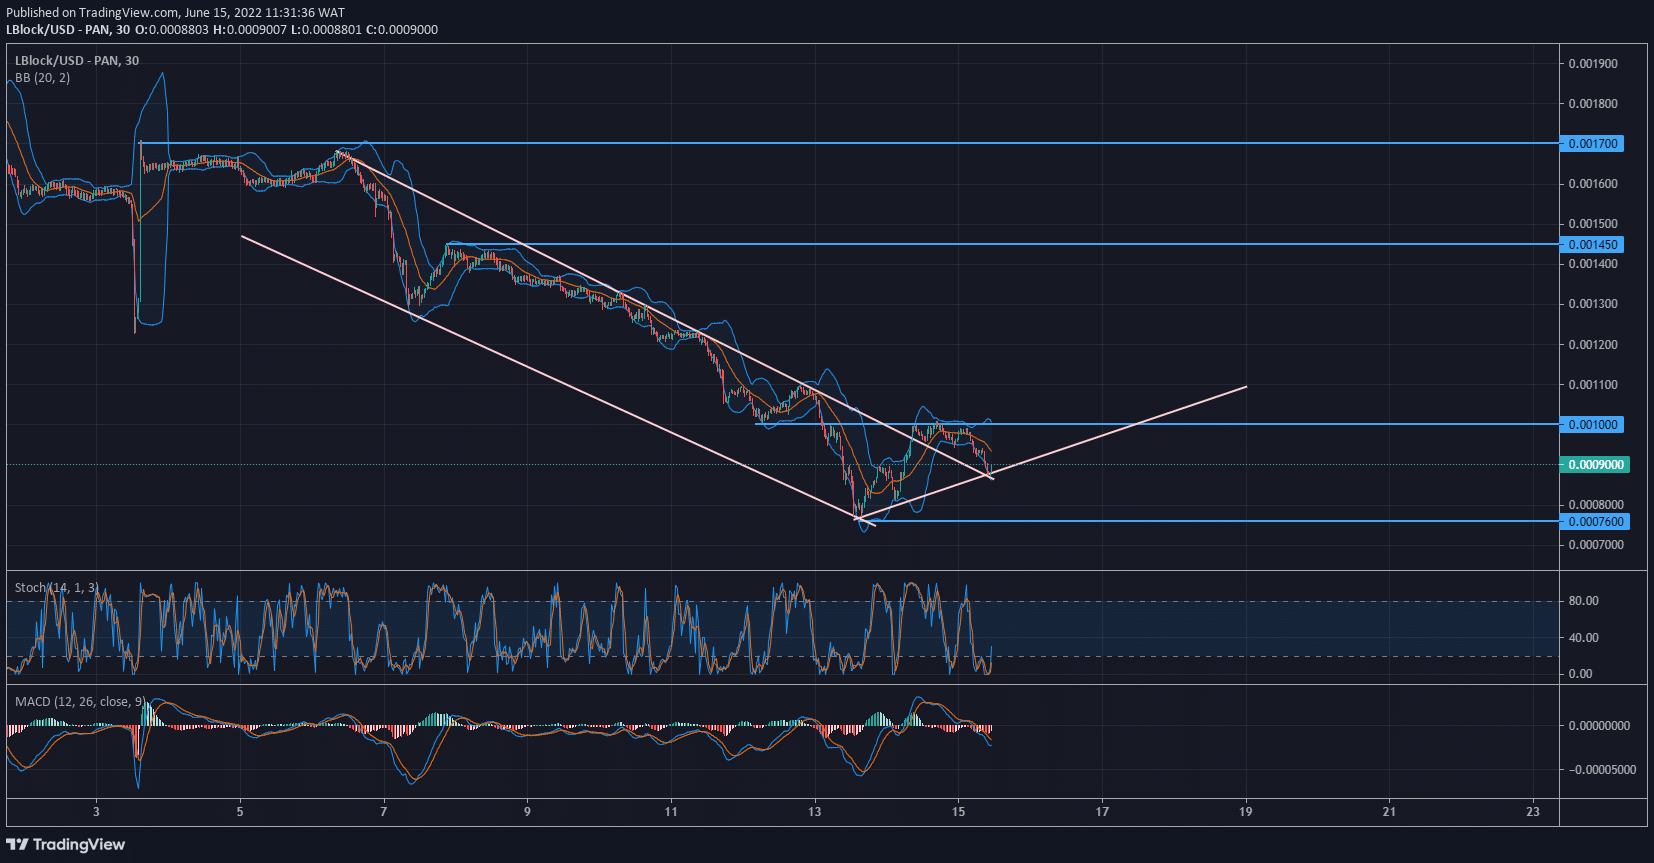
Lucky Block – Guide, Tips & Insights | Learn 2 Trade Price Forecast – Expert Analysis & Trading Tips | Learn 2 Trade – Expert Analysis & Trading Tips | Learn 2 Trade: LBLOCK/USD Outlook
Lucky Block – Guide, Tips & Insights | Learn 2 Trade has descended steadily since the 7th of June. The intraday candles were very sensitive to the Bollinger Bands as the market moved towards the demand levels. On the 7th of June, the bulls made their first attempt to go long. The Moving Average Convergence and Divergence (MACD) and the Stochastic indicators were oversold. The bull pushed up to cross the Moving Average within the Bollinger Bands before getting exhausted.
LBLOCK/USD bulls gathered momentum at $0.000760. The market was oversold on the MACD and the Stochastic. This led to the invalidation of the resistance trend line. An ascending trend line has formed with the higher low after the test of the major level at $0.000760. The previous demand level at $0.001000 was reached after the bulls reacted actively at the $0.000760 support level.
The market has retraced to a bullish confluence point in the 30-minute timeframe. The new bullish trend line and the previous resistance line have converged to support the market to ascend. The Stochastic and the MACD (Moving Average Convergence and Divergence) indicators are also oversold on the 30-minute chart.
LBLOCK/USD Medium-Term Trend: Bullish (5-minute chart)
LBLOCK/USD has shown positive signs, with the breakout prominent on the five-minute chart. The confluence point is likely to provide support to go long.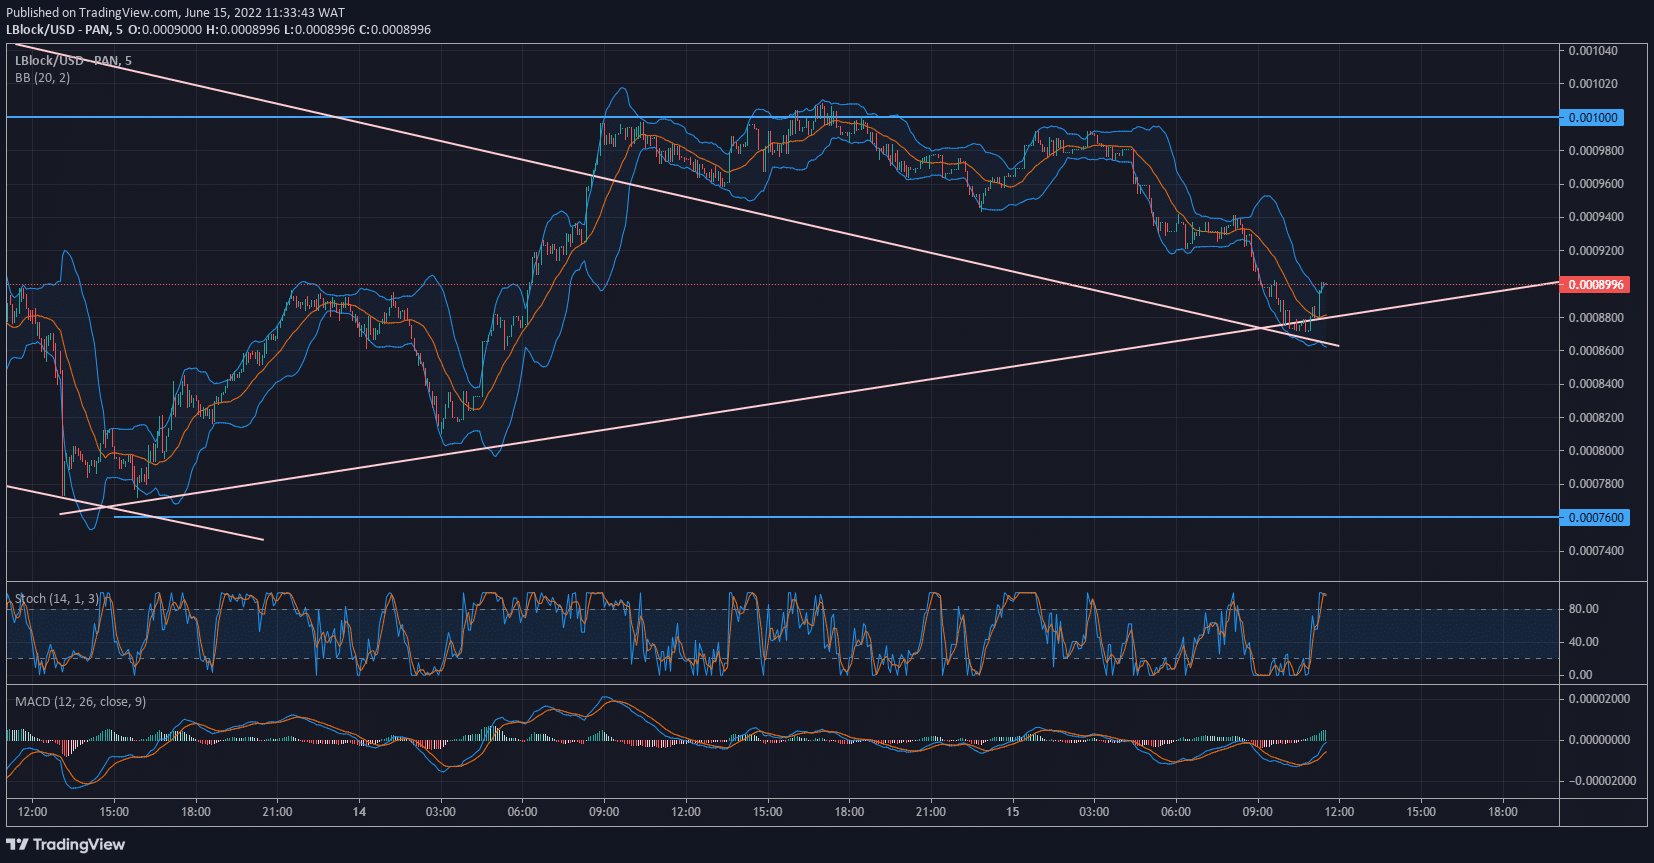
How To Buy Lucky Block – Guide, Tips & Insights | Learn 2 Trade
Note: Learn2.trade is not a financial advisor. Do your research before investing your funds in any financial asset or presented product or event. We are not responsible for your investing results.
- Broker
- Min Deposit
- Score
- Visit Broker

- Award-winning Cryptocurrency trading platform
- $100 minimum deposit,
- FCA & Cysec regulated

- 20% welcome bonus of upto $10,000
- Minimum deposit $100
- Verify your account before the bonus is credited
- Fund Moneta Markets account with a minimum of $250
- Opt in using the form to claim your 50% deposit bonus
Learn to Trade
Never Miss A Trade Again

Signal Notification
Real-time signal notifications whenever a signal is opened, closes or Updated

Get Alerts
Immediate alerts to your email and mobile phone.

Entry Price Levels
Entry price level for every signal Just choose one of our Top Brokers in the list above to get all this free.