

Lucky Block Price Forecast – Expert Analysis & Trading Tips | Learn 2 Trade – Expert Analysis & Trading Tips | Learn 2 Trade – April 27
The Lucky Block price forecast from the price action is likely to create an impulsive breakout from the descending triangle towards $0.00181700
LBLOCK/USD Long-Term Trend: Bullish (30-Minute Chart)
Key Levels:
Supply Zones: $0.001986350, $0.00193400
Demand Zones: $0.0018170, $0.0016770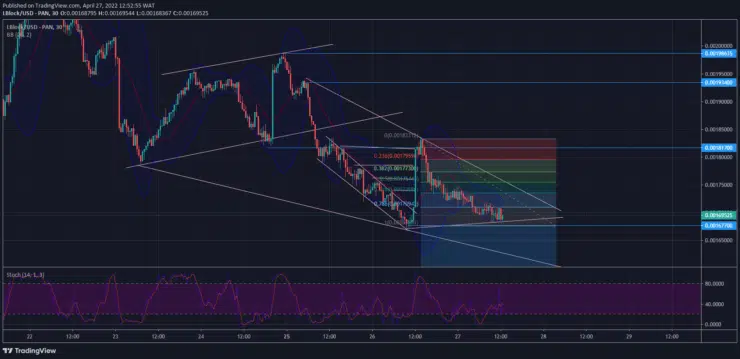
Lucky Block Price Forecast – Expert Analysis & Trading Tips | Learn 2 Trade – Expert Analysis & Trading Tips | Learn 2 Trade: LBLOCK/USD Expectation
The small size of the candles which formed from the major zone at $0.0018170 shows the exhaustion of the bears as they dipped to the demand zone at $0.0016770. Internal highs formed as the price sank from $0.0018170. The bulls did the exact opposite by soaring very rapidly from the demand zone. As the price rose to a premium, all previous internal highs were swept away.
The footprints of the bulls have been revealed clearly with the large impulsive candle. A large gap was left behind due to the speed at which the bulls regained control at the $0.0016770 demand zone. The market is currently in a phase of retracement to cover up the gap.
The market has tapped into the order block it left behind before the price rise. A swing low is currently forming to give the bulls further confirmation to go long.
LBLOCK/USD Medium-Term Trend: Bullish (5-minute chart)
The market has tapped into the support line of the descending triangle. The market is currently ranging around the 78.6% Fibonacci level. A change of character is anticipated to set the bulls on course towards $0.0018170.
How To Buy Lucky Block
Note: Learn2.trade is not a financial advisor. Do your research before investing your funds in any financial asset or presented product or event. We are not responsible for your investing results.


