Lucky Block Price Forecast – Expert Analysis & Trading Tips | Learn 2 Trade – Expert Analysis & Trading Tips | Learn 2 Trade – July 4th, 2025
The Lucky Block price forecast reveals a market in a phase of consolidation following a recent significant price spike.
Lucky Block Key Levels
Support Levels: 0.000003480, 0.000001190, 0.000000670
Resistance Levels: 0.000006193, 0.000008220, 0.000009860
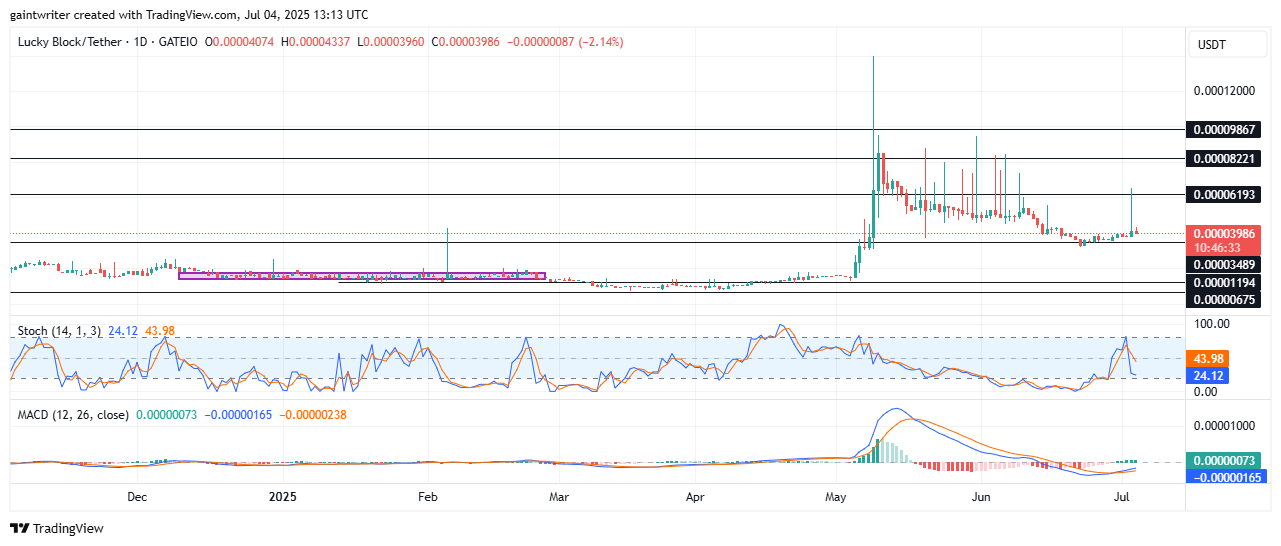
Lucky Block Long-Term Trend: Bullish (Daily Chart)
The daily chart for LBLOCK/USD paints a clear picture of a market that experienced a dramatic and sudden surge in mid-May. This has propelled the price from prolonged consolidation around 0.000001194 to test highs near 0.00001200 level . Following this peak, the price entered a sharp corrective phase throughout June.
Lucky Block Price Forecast – Expert Analysis & Trading Tips | Learn 2 Trade – Expert Analysis & Trading Tips | Learn 2 Trade – LBLOCKUSD Outlook
Currently, the market is showing signs of stabilizing around the 0.000003986 mark, having bounced from the 0.000003489 support. This support level, which was a significant resistance prior to the mid-May pump, has now proven its role as a crucial demand zone. The overall long-term trend, while having a significant pump, is now characterized by attempts to consolidate at a higher price floor than prior to the pump.
Currently trading at 0.000003986, the LBLOCK/USD price reflects a market that is absorbing recent volatility. As of the snapshot, it is down -2.14%, indicating continued short-term selling pressure or profit-taking after the spike. The strong rejection from the 0.000006193 level highlights that while buyers can drive the price up, significant supply quickly emerges at higher resistance points. The market is now focused on whether the price can establish a new, higher support base above the pre-pump consolidation range.
The Stochastic Oscillator is currently at 41.98, trending downwards from overbought conditions. It indicates that the bullish momentum from the spike has largely faded, and the market is moving into a more neutral or slightly bearish short-term phase.
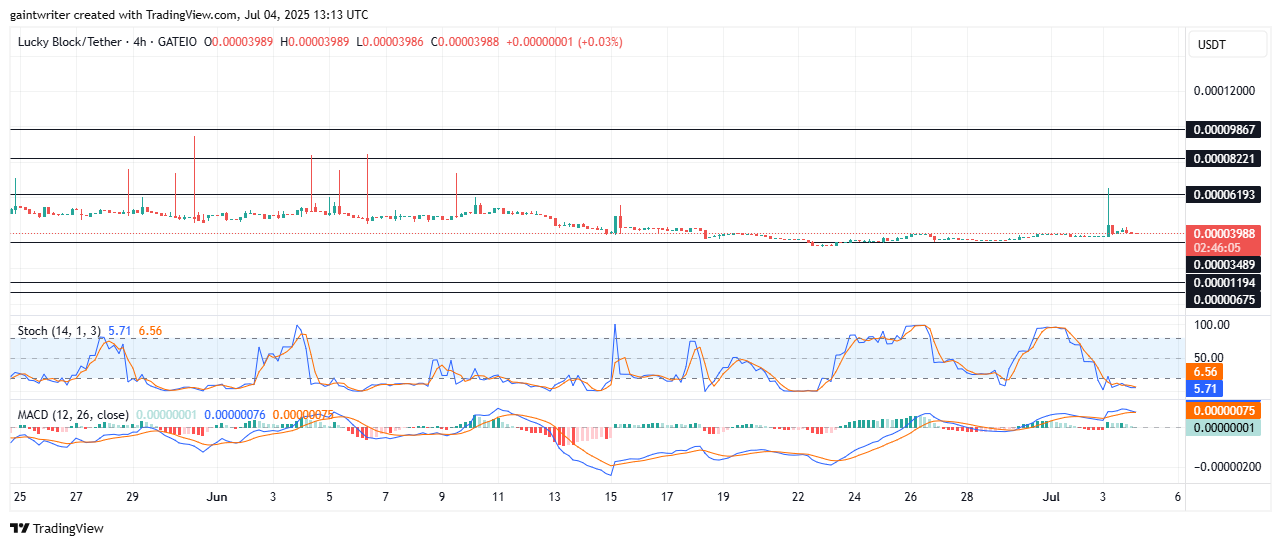
Lucky Block Short-Term Trend: Bullish (4-Hour Chart)
The 4-hour chart provides a more granular view of the recent price action, particularly the sharp upward spike and the subsequent retracement. While the price briefly touched 0.000006193 (and even higher wicks), it quickly pulled back and is now consolidating around 0.000003988. This suggests that while there was a strong buying impulse, it was not sustained, and profit-taking ensued. Buyers are currently attempting to establish a floor at the 0.000003489 level, which was a significant resistance-turned-support.
How To Buy Lucky Block
Note: Learn2.trade is not a financial advisor. Do your research before investing your funds in any financial asset, product, or event. We are not responsible for your investment results.