Lucky Block – Guide, Tips & Insights | Learn 2 Trade Price Forecast – Expert Analysis & Trading Tips | Learn 2 Trade – Expert Analysis & Trading Tips | Learn 2 Trade – March 23
The Lucky Block – Guide, Tips & Insights | Learn 2 Trade price forecast is for the bulls to retain the upper hand as the struggle for supremacy continues. The market is expected to make more upward moves.
LBLOCK/USD Long-Term Trend: Bullish (30-Minute Chart)
Key Levels:
Supply Zones: $0.00578480, $0.00512670, $0.00474100
Demand Zones: $0.00360520, $0.00336565, $0.00220000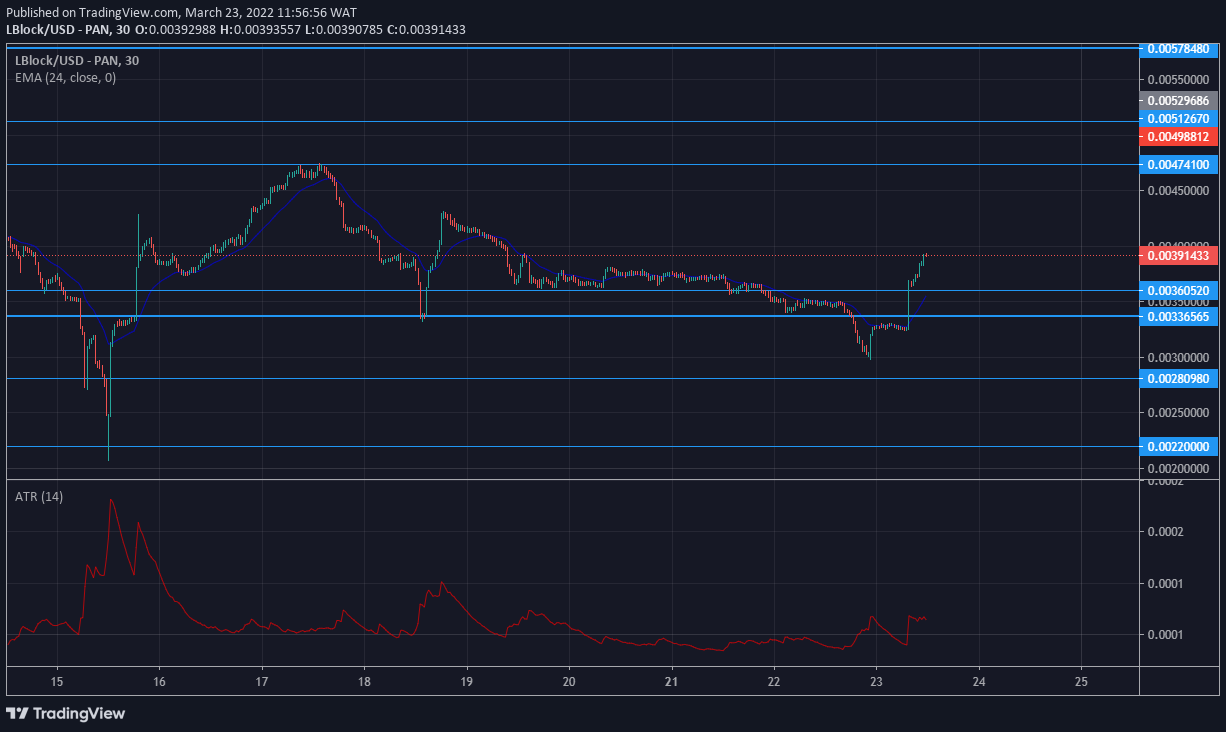
Lucky Block – Guide, Tips & Insights | Learn 2 Trade Price Forecast – Expert Analysis & Trading Tips | Learn 2 Trade – Expert Analysis & Trading Tips | Learn 2 Trade: LBLOCK/USD Anticipation
The tussle for dominance continues on LBlock. Buyers are working hard to regain a market they once dominated entirely. As a result, there is currently a lot of sideways movement in the market.
Nevertheless, the bulls still have the upper hand as the market keeps sideways trending. As seen previously, they tend to accumulate momentum and surge upward from such an event.
The ATR (Average True Range) indicator shows a significant increase in volatility as the price spiked upward from a recent depression. LBlock had also traded to the upside of the EMA (Exponential Moving Average) period 24 for more price increases.
LBLOCK/USD Medium-Term Trend: Bullish (5-minute chart)
As the market was sideways trending, the bears pulled the price below the support level of $0.00336565. This sparked a quick reaction among the buyers, leading to an upwards volatile spike. Both the $0.00360520 and $0.00336565 key levels were breached from the downside again as the price rose.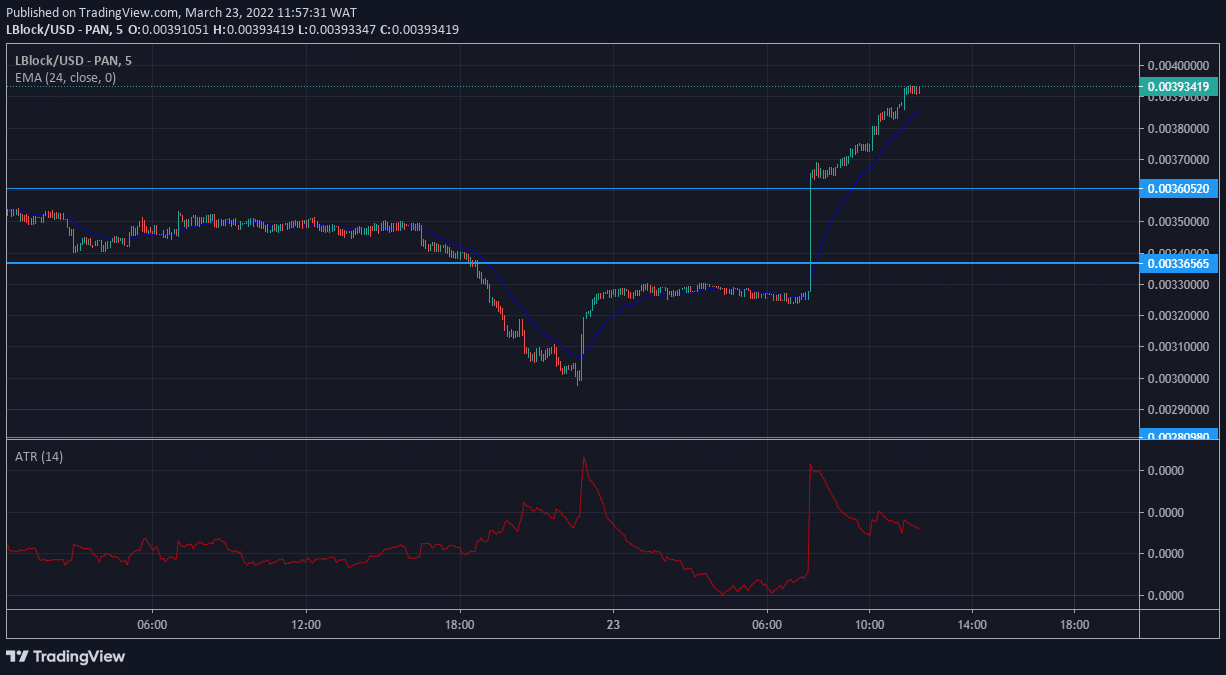
How To Buy Lucky Block – Guide, Tips & Insights | Learn 2 Trade
Note: Learn2.trade is not a financial advisor. Do your research before investing your funds in any financial asset or presented product or event. We are not responsible for your investing results.
- Broker
- Min Deposit
- Score
- Visit Broker

- Award-winning Cryptocurrency trading platform
- $100 minimum deposit,
- FCA & Cysec regulated

- 20% welcome bonus of upto $10,000
- Minimum deposit $100
- Verify your account before the bonus is credited
- Fund Moneta Markets account with a minimum of $250
- Opt in using the form to claim your 50% deposit bonus
Learn to Trade
Never Miss A Trade Again

Signal Notification
Real-time signal notifications whenever a signal is opened, closes or Updated

Get Alerts
Immediate alerts to your email and mobile phone.

Entry Price Levels
Entry price level for every signal Just choose one of our Top Brokers in the list above to get all this free.