Lucky Block – Guide, Tips & Insights | Learn 2 Trade Price Forecast – Expert Analysis & Trading Tips | Learn 2 Trade – Expert Analysis & Trading Tips | Learn 2 Trade – August 10
The Lucky Block – Guide, Tips & Insights | Learn 2 Trade price forecast is for the market to kickstart an uptrend after it breaks the initial barrier of the $0.00064310 resistance level.
LBLOCK/USD Long-Term Trend: Bullish (30-Minute Chart)
Key Levels:
Supply Zones: $0.00066300, $0.000839300
Demand Zones: $0.00062300, $0.00062230 .00064310" width="1226" height="674" data-lazy-src="https://learn2.trade/wp-content/uploads/2022/08/Lblock-30-6.png"/>
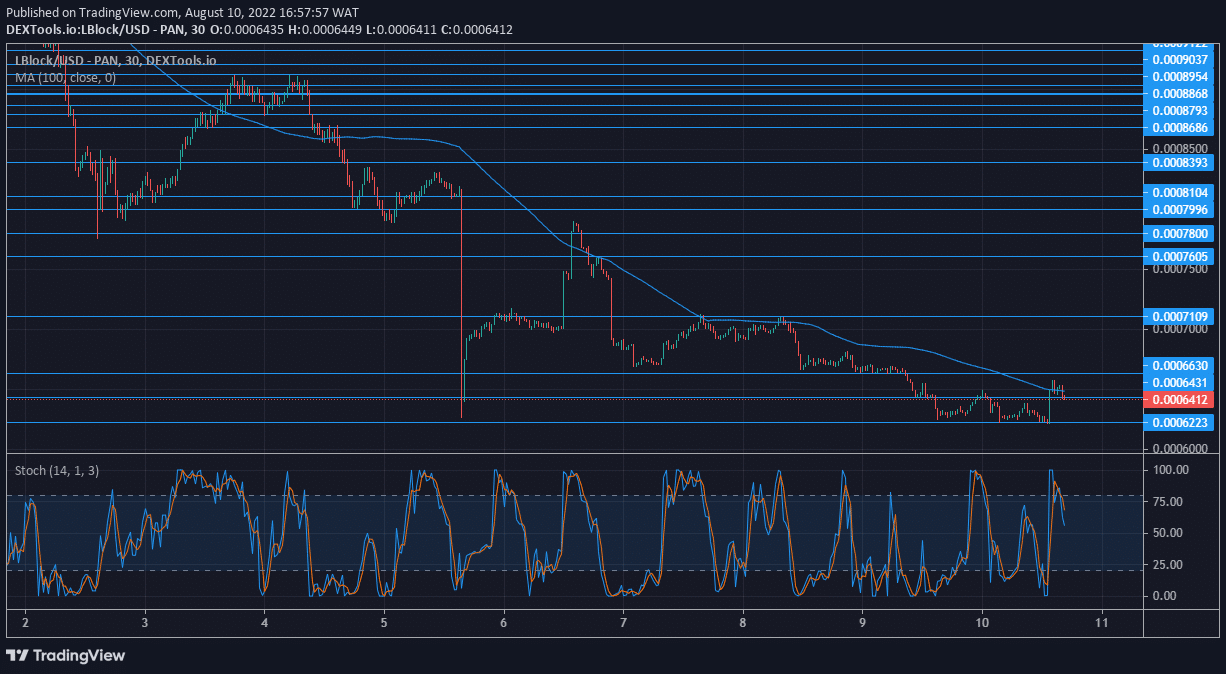
Lucky Block – Guide, Tips & Insights | Learn 2 Trade Market Expectation: LBLOCK/USD Revives Bullishness
Lucky Block – Guide, Tips & Insights | Learn 2 Trade was already on a decline by the 2nd of August. Although there were movements from the bulls to overturn the market right there and then, they had not gained enough stamina to withstand bearish pressure.
Shortly after, the market slumped, bypassing several barriers on its way to reaching the $0.00062230 support level. Again, the buyers immediately gave some resistance, but it didn’t last.
The MA period 100 (Moving Average) remained above the market as resistance all through the period of its declination. However, in the latest turn of events, the price has now traded above it.
LBLOCK/USD Medium-Term Trend: Bullish (5-minute chart)
The 5-minute chart shows more details about what happened as the coin changed from a bearish outlook to a bullish campaign. After the market crashes to the $0.00062230 support level, the bulls were able to withstand the pressure to avoid a further dip. Meanwhile, the market started to test the next upward level at $0.00064310.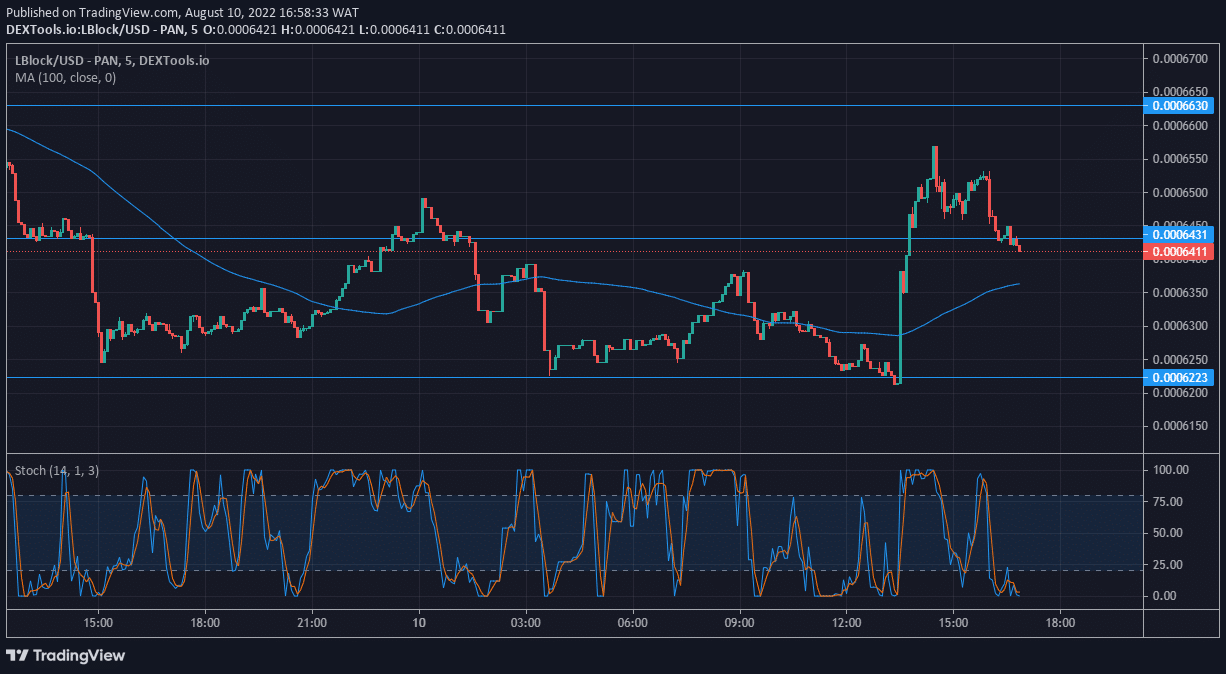
You can purchase Lucky Block – Guide, Tips & Insights | Learn 2 Trade here. Buy LBLOCK:
Note: Learn2.trade is not a financial advisor. Do your research before investing your funds in any financial asset or presented product or event. We are not responsible for your investing results.
- Broker
- Min Deposit
- Score
- Visit Broker

- Award-winning Cryptocurrency trading platform
- $100 minimum deposit,
- FCA & Cysec regulated

- 20% welcome bonus of upto $10,000
- Minimum deposit $100
- Verify your account before the bonus is credited
- Fund Moneta Markets account with a minimum of $250
- Opt in using the form to claim your 50% deposit bonus
Learn to Trade
Never Miss A Trade Again

Signal Notification
Real-time signal notifications whenever a signal is opened, closes or Updated

Get Alerts
Immediate alerts to your email and mobile phone.

Entry Price Levels
Entry price level for every signal Just choose one of our Top Brokers in the list above to get all this free.