

Lucky Block Price Anticipation – July 6
The Lucky Block price anticipation is for the market to break past its current resistance zone and continue its bullish adventure to reclaim higher price levels.
LBLOCK/USD Long-Term Trend: Bullish (30-Minute Chart)
Key Levels:
Supply Zones: $0.00093270, $0.00092110
Demand Zones: $0.00091220, $0.00089540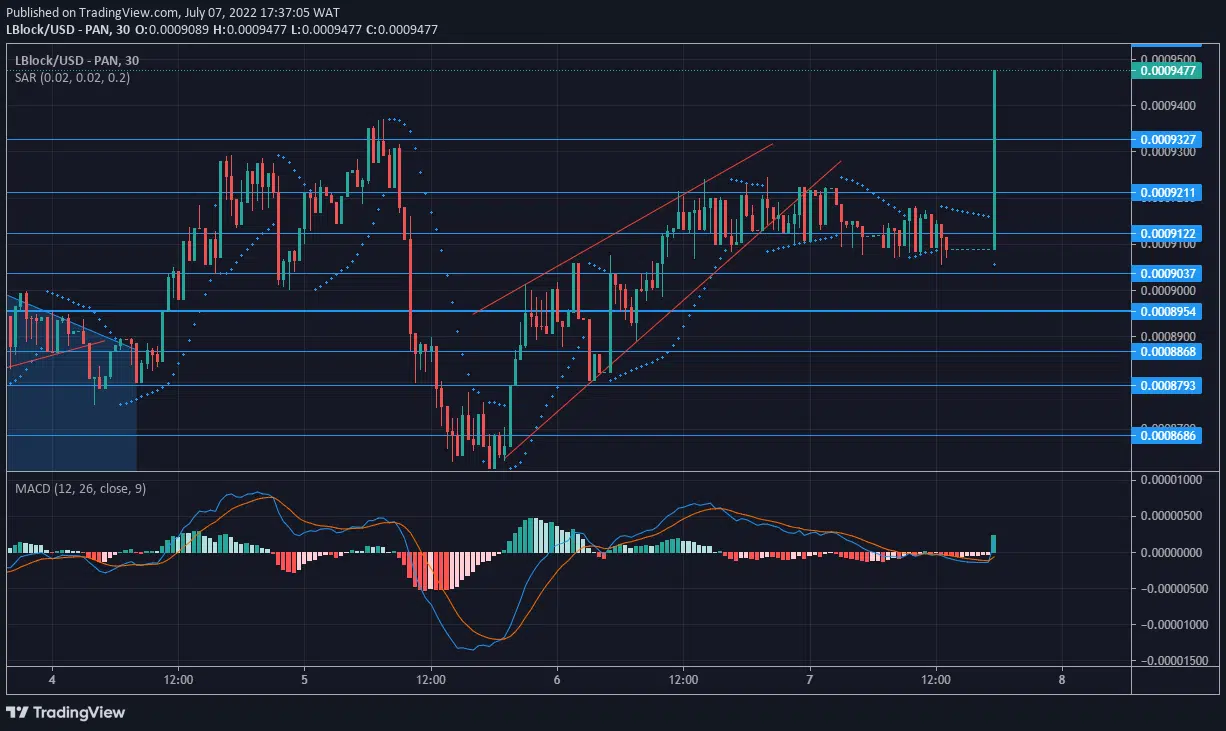
Lucky Block Market Prediction – Expert Analysis & Trading Tips | Learn 2 Trade: LBLOCK/USD Continues in an Uptrend
On the 4th of July, the market broke out of a descending channel formation to begin an uptrend. The price rose quickly and got to the $0.0009327 supply level by the 5th, where it was rejected and dipped.
Similarly, Lblock dropped strongly to reach a significant support level at $0.0008686. It is at this point that the bulls begin to engineer a reversal. The price took off with consecutive bullish candles on the same day.
The 6th and 7th of July were used to push the price through a rising wedge pattern till it hit a supply zone at $0.00092110. Lblock is battling to continue its uptrend. The Parabolic SAR (Stop and Reverse) alternates around the candles.
LBLOCK/USD Medium-Term Trend: Bullish (5-minute chart)
Something remarkable is happening in the market. As the price keeps struggling to break through the $0.00092110 resistance, it lays low for some hours, and then a significant upward spike appears at the time of writing. The spike makes a meal of the $0.00092110 resistance and shoots further upwards past several levels.
How To Buy Lucky Block
Note: Learn2.trade is not a financial advisor. Do your research before investing your funds in any financial asset or presented product or event. We are not responsible for your investing results.


