Lucky Block – Guide, Tips & Insights | Learn 2 Trade Market Prediction – Expert Analysis & Trading Tips | Learn 2 Trade: December 8
The Lucky Block – Guide, Tips & Insights | Learn 2 Trade market prediction is that as consolidation continues, there is hope for a bullish reversal as the market forms a new asymmetric triangle pattern.
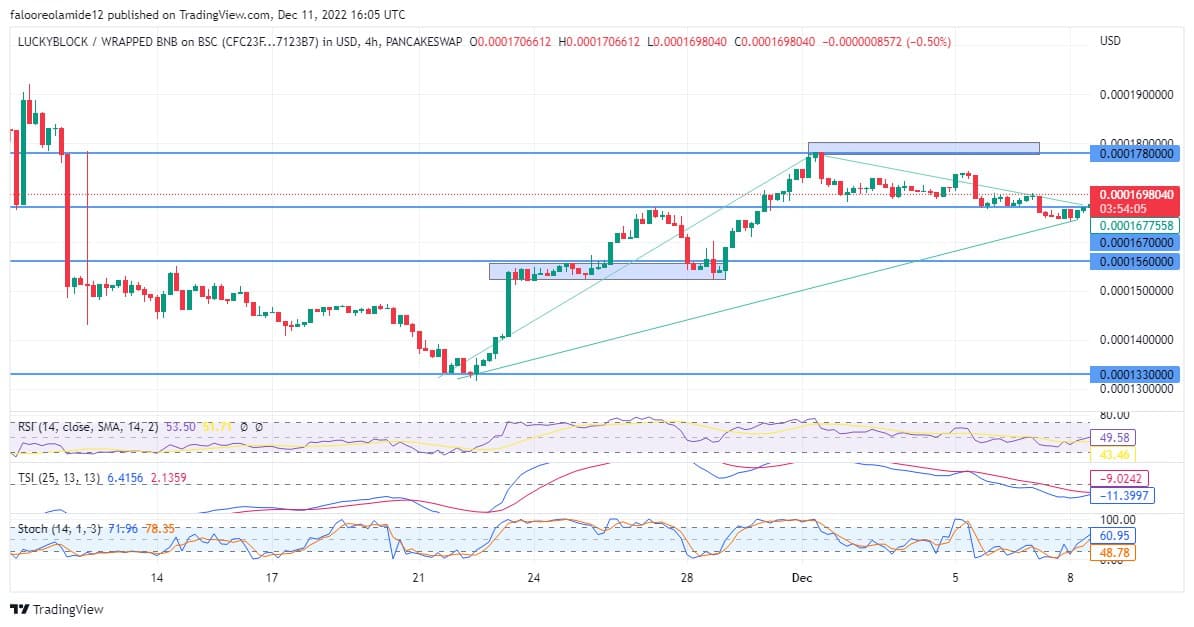
LBLOCK/USD Long-Term Trend: Bullish (4-hour Chart)
Key Levels:
Zones of supply: $0.00015550, $0.0001670, $0.00017830
Zones of Demand: $0.00016670, $0.0001570, $0.0001990, $0.00013320

From the $0.000150 price level, the price of LBLOCKUSD increased significantly to reach its current peak before descending into a range. The market has been fluctuating between $0.000178 and $0.000167 since the LBLOCK price reached a high of $0.0001780 early in the month.
Lucky Block – Guide, Tips & Insights | Learn 2 Trade Market Prediction – Expert Analysis & Trading Tips | Learn 2 Trade: LBLOCK/USD Anticipation
Recently, the market moved beneath the range levels to force a return to a bullish order. This move is an effort to attract additional consumers who are looking to buy at a price dip.
A new bullish takeover is being signaled by the Stochastic Oscillator indicator, which reveals that LBLOCK is already moving in an oversold direction.
The Relative Strength Index’s indicator makes it clear that the market is moving toward an oversold point. Soon as the price returns to the consolidation zone, a bullish takeover should be expected.
On the other hand, the True Strength Index lines have crossed below the indicator’s signal line. This accurately depicts the activity of recent market sellers. The bulls must now reclaim their positions in the Lucky Block – Guide, Tips & Insights | Learn 2 Trade market because sellers have been forced into an oversold area as the indicator signal.
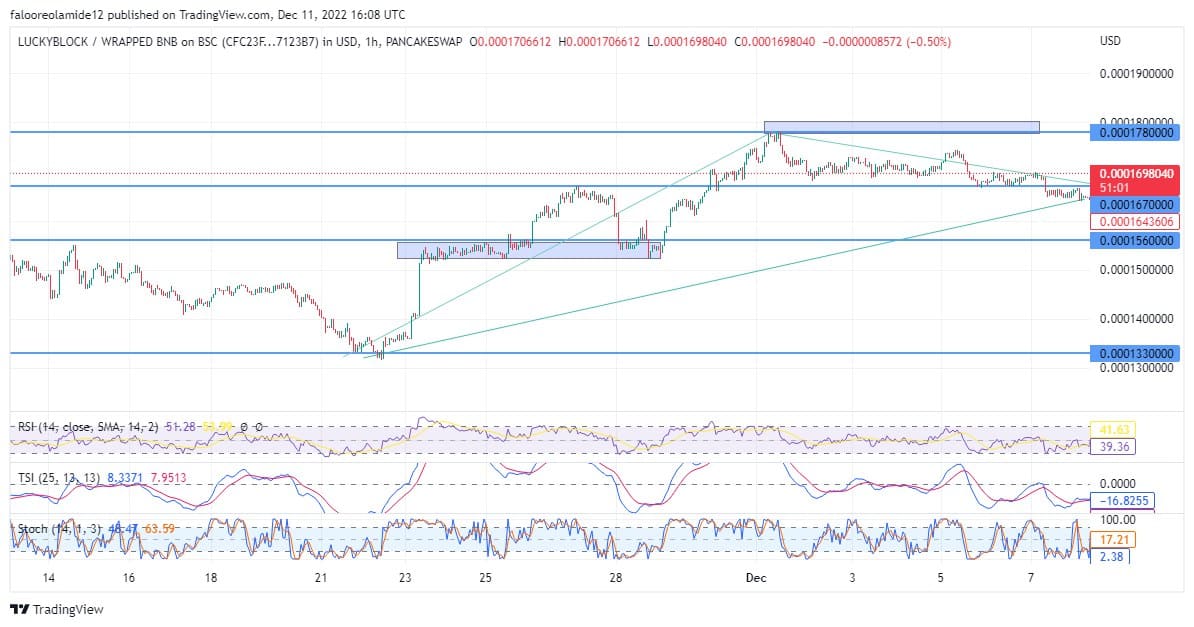
LBLOCK/USD Medium-Term Trend: Bullish (1-hour chart)
The LBLOCKUSD price continues to fluctuate along these upper-restriction price levels on the hourly chart. The Stochastic Oscillator lines, however, have crossed the midline, indicating that the bulls have returned to the market.

The RSI signal shows that the market is currently in an unfavorable position for more sales. It is expected that the market will soon return to significant price levels. At that point, the price will certainly reach the current price ceiling.
How To Buy Lucky Block – Guide, Tips & Insights | Learn 2 Trade
Note: Learn2.trade is not a financial advisor. Do your research before investing your funds in any financial asset or presented product or event. We are not responsible for your investing results.
- Broker
- Min Deposit
- Score
- Visit Broker
- Award-winning Cryptocurrency trading platform
- $100 minimum deposit,
- FCA & Cysec regulated
- 20% welcome bonus of upto $10,000
- Minimum deposit $100
- Verify your account before the bonus is credited
- Fund Moneta Markets account with a minimum of $250
- Opt in using the form to claim your 50% deposit bonus
Learn to Trade
Never Miss A Trade Again

Signal Notification
Real-time signal notifications whenever a signal is opened, closes or Updated

Get Alerts
Immediate alerts to your email and mobile phone.

Entry Price Levels
Entry price level for every signal Just choose one of our Top Brokers in the list above to get all this free.


