Lucky Block – Guide, Tips & Insights | Learn 2 Trade Market Prediction – Expert Analysis & Trading Tips | Learn 2 Trade: December 20
The Lucky Block – Guide, Tips & Insights | Learn 2 Trade market prediction is for the coin to maintain its strong demand level, from which a rally is set to take place.
LBLOCK/USD Long-Term Trend: Bullish (1-Day Chart)
Key Levels:
Zones of supply: $0002980, $0.0002460, $0.0002150
Zones of Demand: $0.0002040, $0.0001990, $0.0001360
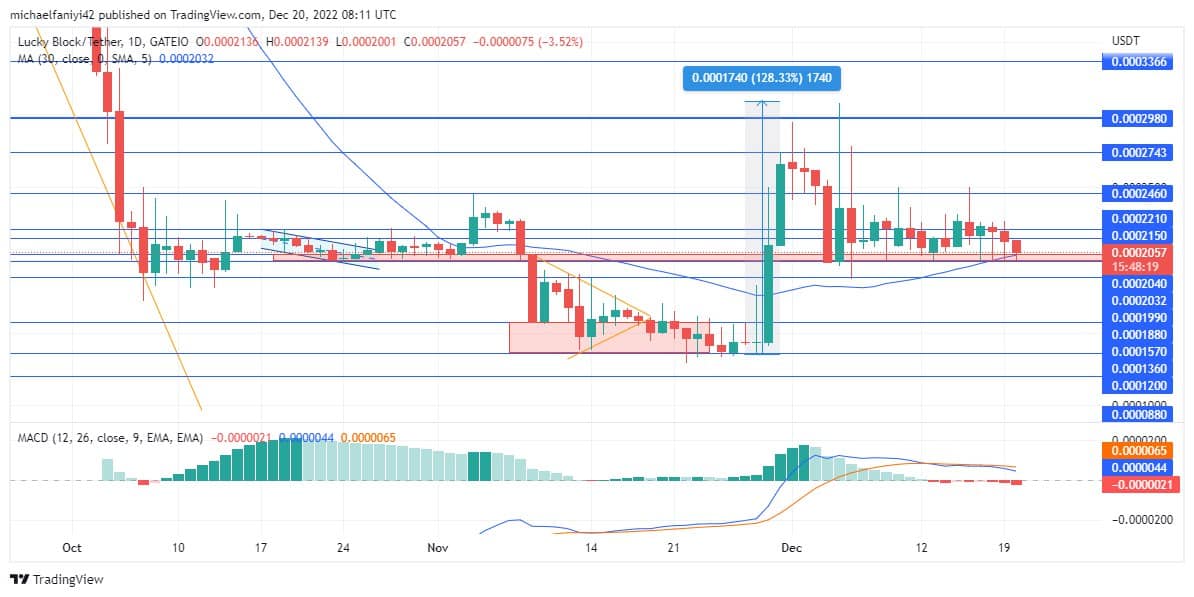
LBLOCK/USD is still insistent on finding a way beyond the new resistance level at $0.0002980. The price rose to this resistance level at the beginning of this month and was rejected. Since then, the price has maintained a solid grip at $0.0001990 (which stretches to $0.0002040). The bulls are expected to take advantage of the demand zone for a rally.
Lucky Block – Guide, Tips & Insights | Learn 2 Trade Market Prediction – Expert Analysis & Trading Tips | Learn 2 Trade: LBLOCK/USD Anticipation
The market rose by more than 100% to reach the $0.0002980 resistance level from where it was rejected on the 1st of December. With a long spike on December 5th, the price would rise to test the supply once more.
In general, the sellers have piled pressure on the market since it tested the $0.0002980 resistance level twice. Nevertheless, the market maintains a formidable demand zone around $0.0001990.
The bulls are expected to take advantage of this strong demand level to rally the price. In addition, the MA period 30 (Moving Average) remains below the candlesticks to give it an extra layer of support.
LBLOCK/USD Medium-Term Trend: Bullish (4-hour chart)
The buyers demonstrate their supreme control over the market on the MACD (Moving Average Convergence Divergence) indicator, despite the drop off of the market at the $0.0002980 resistance. The bullish bars have been predominant ever since. Only recently have the histogram bars been reduced, but the lines remain above zero.
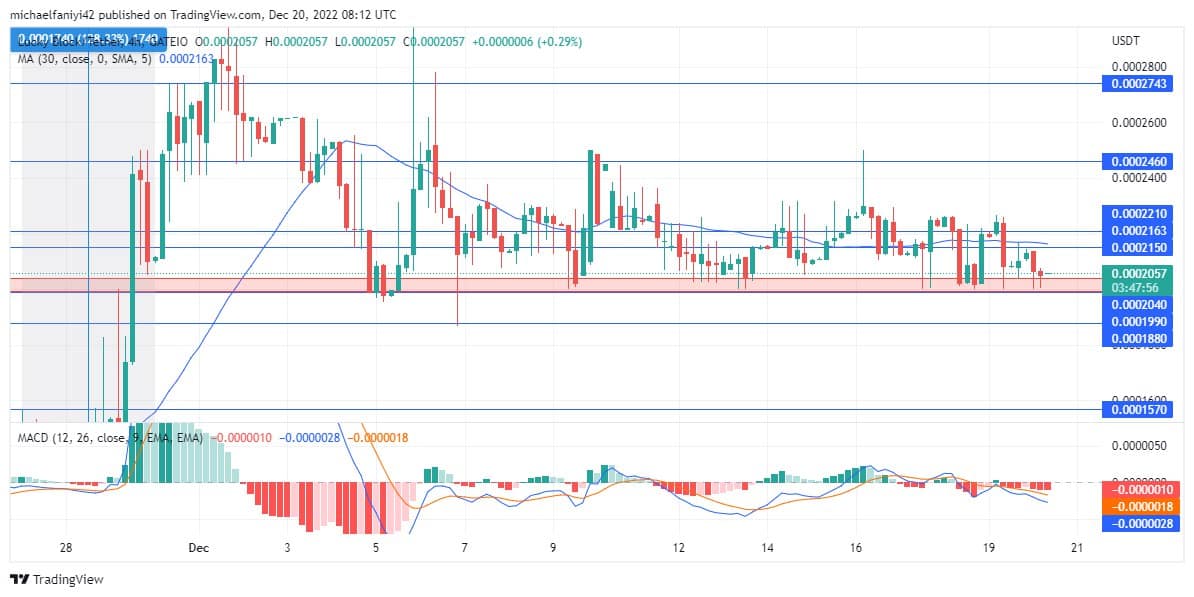
On the 4-hour chart, there are indications of range in the market. The MA period 30 is sliding through the 4-hour candles. Also, the MACD chart has its lines fluctuating around the mid-level. This is an indication that the price has been halted from dropping below the $0.0001990 level. Buyers are expected to drive the market higher shortly.
How To Buy Lucky Block – Guide, Tips & Insights | Learn 2 Trade
Note: Learn2.trade is not a financial advisor. Do your research before investing your funds in any financial asset or presented product or event. We are not responsible for your investing results.
- Broker
- Min Deposit
- Score
- Visit Broker

- Award-winning Cryptocurrency trading platform
- $100 minimum deposit,
- FCA & Cysec regulated

- 20% welcome bonus of upto $10,000
- Minimum deposit $100
- Verify your account before the bonus is credited
- Fund Moneta Markets account with a minimum of $250
- Opt in using the form to claim your 50% deposit bonus
Learn to Trade
Never Miss A Trade Again

Signal Notification
Real-time signal notifications whenever a signal is opened, closes or Updated

Get Alerts
Immediate alerts to your email and mobile phone.

Entry Price Levels
Entry price level for every signal Just choose one of our Top Brokers in the list above to get all this free.