Lucky Block – Guide, Tips & Insights | Learn 2 Trade Market Prediction – Expert Analysis & Trading Tips | Learn 2 Trade – April 6
The Lucky Block – Guide, Tips & Insights | Learn 2 Trade market prediction is for the buyers to gather strength to break through a familiar resistance level at $0.00336565.
LBLOCK/USD Long-Term Trend: Bullish (30-Minute Chart)
Key Levels:
Supply Zones: $0.00474100, $0.00336565
Demand Zones: $0.00264600, $0.00134480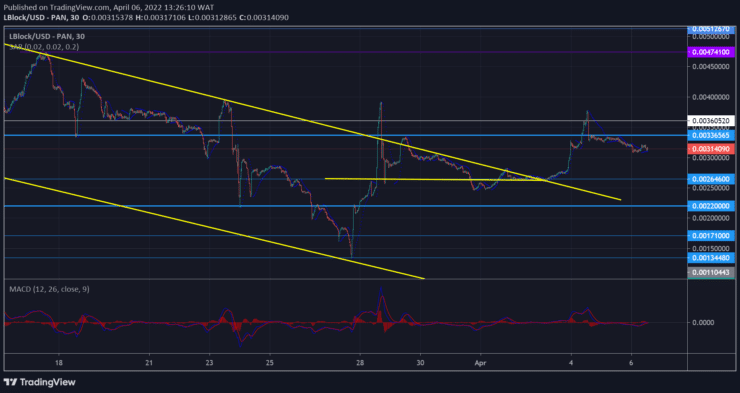
Lucky Block – Guide, Tips & Insights | Learn 2 Trade Market Prediction – Expert Analysis & Trading Tips | Learn 2 Trade: LBLOCK/USD Anticipation
The $0.00336565 level is a familiar resistance level for the market. The price rose to this level while still within the descending channel.
An initial breakout was followed by a slump back below the level and conformation back to the descending channel.
Having broken out of the channel, the price has more liberty to rally from below the level. The alternating movement of the Parabolic SAR (Stop and Reverse) shows market consolidation.
LBLOCK/USD Medium-Term Trend: Bullish (5-minute chart)
The MACD (Moving Average Convergence Divergence) indicator on the 30-minute chart is moving close to the zero level but from a bearish stance, but there is currently an upturn as the price has crossed upward. However, on the 5-minute chart, the lines are already above the zero level and are dropping.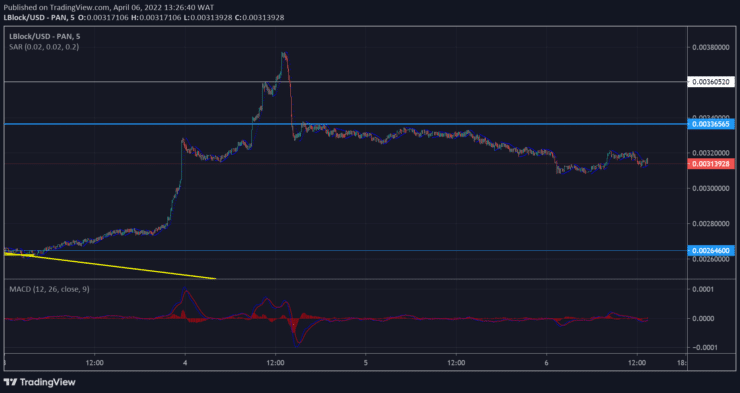
How To Buy Lucky Block – Guide, Tips & Insights | Learn 2 Trade
Note: Learn2.trade is not a financial advisor. Do your research before investing your funds in any financial asset or presented product or event. We are not responsible for your investing results.
- Broker
- Min Deposit
- Score
- Visit Broker

- Award-winning Cryptocurrency trading platform
- $100 minimum deposit,
- FCA & Cysec regulated

- 20% welcome bonus of upto $10,000
- Minimum deposit $100
- Verify your account before the bonus is credited
- Fund Moneta Markets account with a minimum of $250
- Opt in using the form to claim your 50% deposit bonus
Learn to Trade
Never Miss A Trade Again

Signal Notification
Real-time signal notifications whenever a signal is opened, closes or Updated

Get Alerts
Immediate alerts to your email and mobile phone.

Entry Price Levels
Entry price level for every signal Just choose one of our Top Brokers in the list above to get all this free.