

Lucky Block – Guide, Tips & Insights | Learn 2 Trade Price Prediction – February 21
The Lucky Block – Guide, Tips & Insights | Learn 2 Trade market prediction is for the price to make another foray upward to retest the $0.0001990 resistance level.
LBLOCK/USD Long-Term Trend: Bullish (1-Day Chart)
Key Levels:
Zones of supply: $0002980, $0.0002040, $0.0001990
Zones of Demand: $0.0001570, $0.0001360, $0.0001250
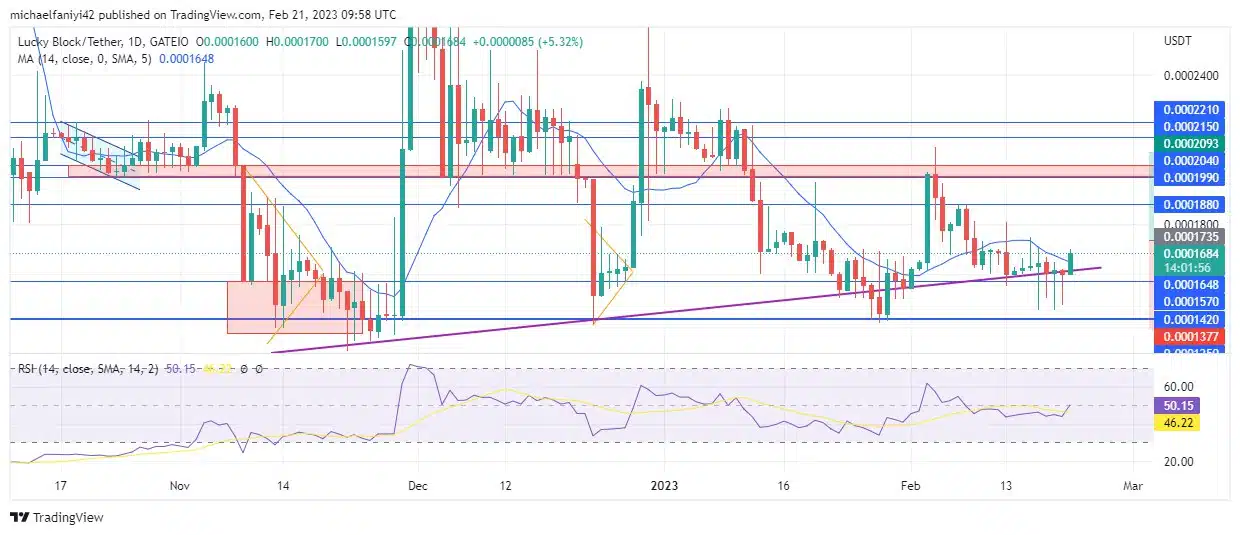
The Lucky Block – Guide, Tips & Insights | Learn 2 Trade remains in the process of cracking through the $0.0001990 resistance level to rise higher. Currently, the odds are in the buyers’ favor as a bullish candlestick is emerging. All indications are pointing towards a rise that will test the $0.0001990 level at this time and may likely break further upward above $0.0002040.
Lucky Block – Guide, Tips & Insights | Learn 2 Trade Market Prediction – Expert Analysis & Trading Tips | Learn 2 Trade: LBLOCK/USD Anticipation
The Lucky Block – Guide, Tips & Insights | Learn 2 Trade price action from mid-January until now shows the intent of the buyers to rise back above the $0.0002040 level. However, the $0.0001990 level stands as a barrier.
Hence, the coin has been continually testing the $0.0001990 line to discover a point of weakness to exploit. The market is again on one of these forays, as the price rises above the $0.0001570 demand zone.
The current rise in price has pushed the market above the 14-period MA (Moving Average). Also, the RSI (Relative Strength Index) line is about to move above the middle line of its chart.
LBLOCK/USD Medium-Term Trend: Bullish (4-hour chart)
The 4-hour chat presents a cause for more optimism among the buyers trying to go long on the market. The MA period 14 has dropped below the candlesticks to support the rising market. It indicates a bullish market into which traders can enter.

The RSI line has broken above the middle line of the RSI chart and surged further upwards towards the overbought border. The buyers are obviously in control of the market in the shorter time frame and are carrying that into the daily time frame. The coin is to rise to the $0.0001990 resistance and beyond.
How To Buy Lucky Block – Guide, Tips & Insights | Learn 2 Trade
Note: Learn2.trade is not a financial advisor. Do your research before investing your funds in any financial asset or presented product or event. We are not responsible for your investing results.
- Broker
- Min Deposit
- Score
- Visit Broker

- Award-winning Cryptocurrency trading platform
- $100 minimum deposit,
- FCA & Cysec regulated

- 20% welcome bonus of upto $10,000
- Minimum deposit $100
- Verify your account before the bonus is credited


- Fund Moneta Markets account with a minimum of $250
- Opt in using the form to claim your 50% deposit bonus


