Lucky Block – Guide, Tips & Insights | Learn 2 Trade Market Prediction – Expert Analysis & Trading Tips | Learn 2 Trade: January 5
The Lucky Block – Guide, Tips & Insights | Learn 2 Trade market prediction is for the bulls to remain firm in their resolve to keep hold of the market until the bullish structure is complete.
LBLOCK/USD Long-Term Trend: Bullish (1-Day Chart)
Key Levels:
Zones of supply: $0002980, $0.0002460, $0.0002150
Zones of Demand: $0.0001880 $0.0001570 $0.0001360
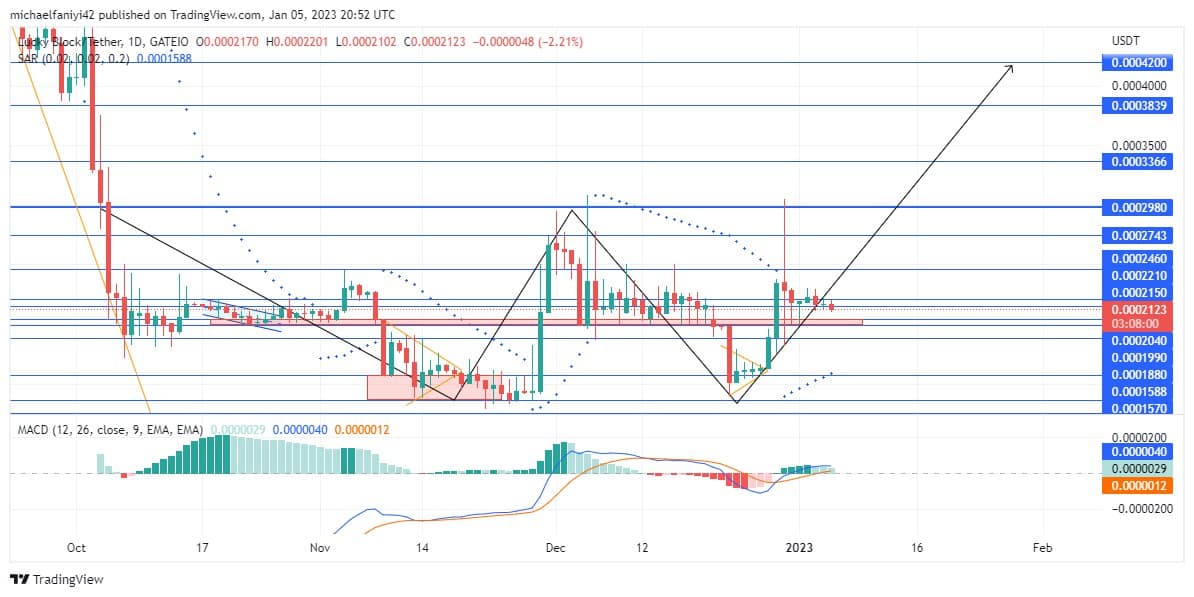
Lucky Block – Guide, Tips & Insights | Learn 2 Trade is expected to break out from its $0.0002980 limitation using a bullish structure. The bulls have been able to steer the price action in their favor so far to structure the market into a double-bottom chart pattern. The last line of the structure is being formed, and when this is done, it is expected to break through the $0.0002980 resistance and release the coin for further price rise.
Lucky Block – Guide, Tips & Insights | Learn 2 Trade Market Prediction – Expert Analysis & Trading Tips | Learn 2 Trade: LBLOCK/USD Anticipation
The LBLOCKUSD market has been exhibiting different price actions as opposing forces try to pull the market their way. Nevertheless, the bulls have the situation under control as they have tuned the market in their favor.
The price has been structured into a bullish reversal double-bottom chart pattern. The $0.0001360 price level acts as a very solid support base, from which the coin has bounced up twice.
The resistance level of $0.0002980 is to be breached. The indicators are showing bullish dominance. The Parabolic SAR (Stop and Reverse) dots line up below the candles despite a seeming sideways trend.
LBLOCK/USD Medium-Term Trend: Bullish (4-hour chart)
The MACD (Moving Average Convergence Divergence) chart on the daily time frame is strongly bullish. Its lines have had a steady uptrend, which has not culminated in rising above the zero level. The candles are set for an upsurge that will break the $0.0002980 resistance level and release the market to a continuous upward drive beyond the resistance level.
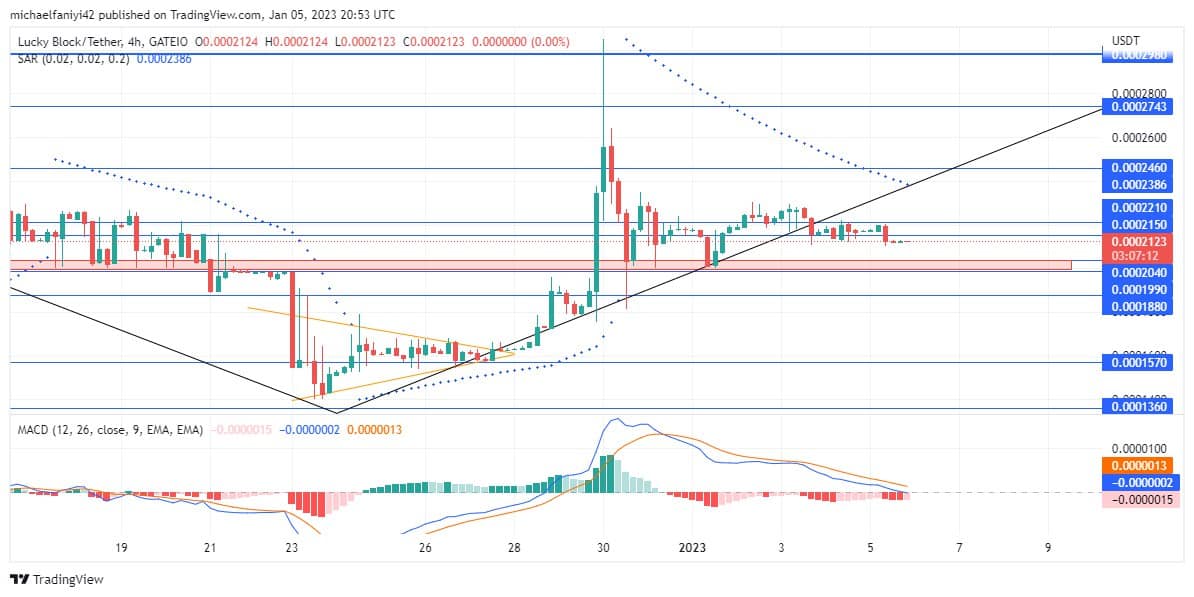
The Parabolic SAR dots align above the candles on the 4-hour chart due to an initial rejection of the price at the $0.0002980 resistance level. However, the market is due for another surge. The MACD lines on the 4-hour time frame are currently above the zero level, and holding above it will confirm the bullish position.
How To Buy Lucky Block – Guide, Tips & Insights | Learn 2 Trade
Note: Learn2.trade is not a financial advisor. Do your research before investing your funds in any financial asset or presented product or event. We are not responsible for your investing results.
- Broker
- Min Deposit
- Score
- Visit Broker

- Award-winning Cryptocurrency trading platform
- $100 minimum deposit,
- FCA & Cysec regulated

- 20% welcome bonus of upto $10,000
- Minimum deposit $100
- Verify your account before the bonus is credited
- Fund Moneta Markets account with a minimum of $250
- Opt in using the form to claim your 50% deposit bonus
Learn to Trade
Never Miss A Trade Again

Signal Notification
Real-time signal notifications whenever a signal is opened, closes or Updated

Get Alerts
Immediate alerts to your email and mobile phone.

Entry Price Levels
Entry price level for every signal Just choose one of our Top Brokers in the list above to get all this free.