Lucky Block – Guide, Tips & Insights | Learn 2 Trade Market Forecast – February 2
The Lucky Block – Guide, Tips & Insights | Learn 2 Trade market forecast is an imminent reversal as price approaches a strong key level at $0.0009490
LBLOCK/USD Long-term Trend: Bullish (Daily Chart)
Key levels:
Supply Levels: $0.0015300, $0.0019700, $0.0022000
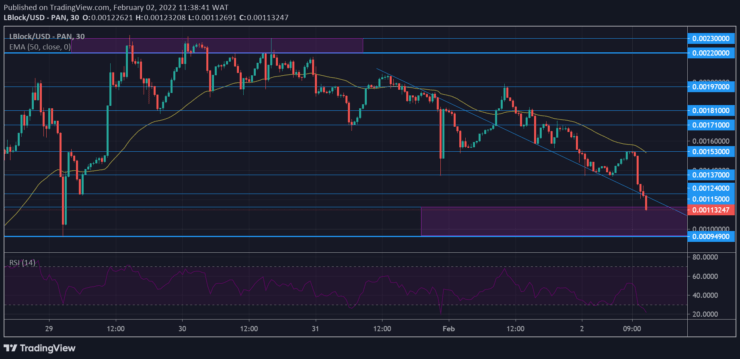
Demand Levels: $0.0009490, $0.0012400, $0.0013700
Lucky Block – Guide, Tips & Insights | Learn 2 Trade Market Forecast: What to expect from LBlock?
Lucky Block – Guide, Tips & Insights | Learn 2 Trade has gradually been influenced by the bears as it rose. It first met strong resistance at $0.001970 on the 28th of January. This caused a swift decline in the market. LBlock kept dropping till it reached the strong support level at $0.0009490.
Bulls waited until the price touched the support level before swooping in and pushing the market higher. Lucky Block – Guide, Tips & Insights | Learn 2 Trade, therefore, violated several key levels, including the $0.001970 price level where it dropped earlier.
However, on reaching a key level at $0.002200, the bears resumed their influence and entered into a tussle with the bulls. This led to consolidation for two days, after which the price began to succumb to bearish influence. Since then, the price has plunged 44% to $0.00122380. However, buyers can be confident of a strong support level lying ahead at $0.0009490. The dip of the Relative Strength Index into an oversold status means a simple trigger will push the price up.
LBLOCK/USD Medium-Term Trend: Bearish (5-minute chart)
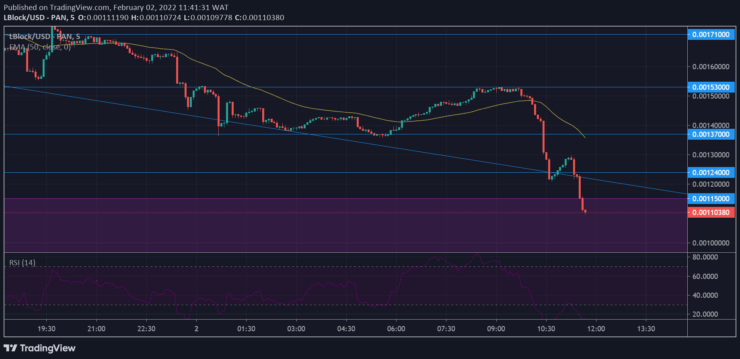
On the 5-minutes chart, the bears have been pushing the market strongly and the price has now broken below the confluence zone of the downtrend line and the $0.0012400 level. Like the 30-minute chart, the EMA period 50 (Exponential Moving Average) remains above the market to show bearishness.
How To Buy Lucky Block – Guide, Tips & Insights | Learn 2 Trade
Note: Learn2.trade is not a financial advisor. Do your research before investing your funds in any financial asset or presented product or event. We are not responsible for your investing results.
- Broker
- Min Deposit
- Score
- Visit Broker
- Award-winning Cryptocurrency trading platform
- $100 minimum deposit,
- FCA & Cysec regulated
- 20% welcome bonus of upto $10,000
- Minimum deposit $100
- Verify your account before the bonus is credited
- Fund Moneta Markets account with a minimum of $250
- Opt in using the form to claim your 50% deposit bonus
Learn to Trade
Never Miss A Trade Again

Signal Notification
Real-time signal notifications whenever a signal is opened, closes or Updated

Get Alerts
Immediate alerts to your email and mobile phone.

Entry Price Levels
Entry price level for every signal Just choose one of our Top Brokers in the list above to get all this free.


