Lucky Block – Guide, Tips & Insights | Learn 2 Trade Market Expectation – July 13
Lucky Block – Guide, Tips & Insights | Learn 2 Trade market expectation is for the price to respond to promptings of the buyers. There are already signs to show that market reversal is ongoing.
LBLOCK/USD Long-Term Trend: Bullish (30-Minute Chart)
Key Levels:
Supply Zones: $0.00095460, $0.00081040
Demand Zones: $0.00078000, $0.00086860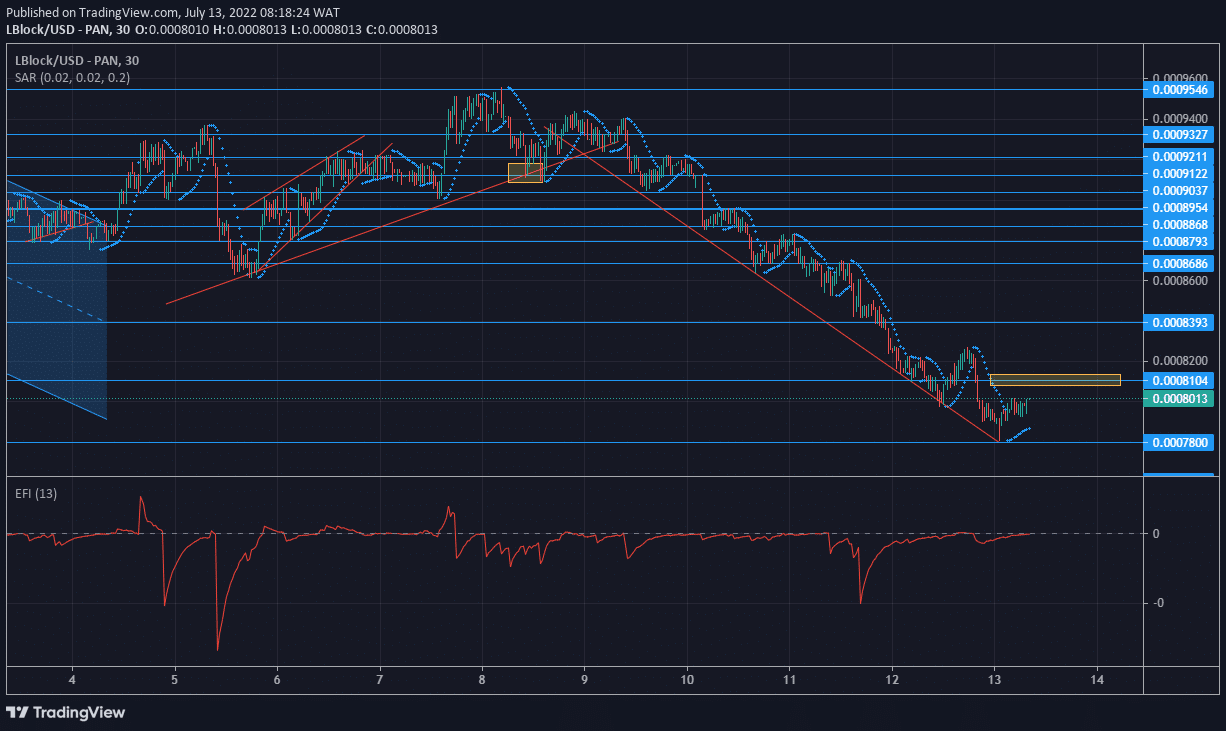
Lucky Block – Guide, Tips & Insights | Learn 2 Trade Market Expectation: LBLOCK/USD revives bullishness
The $0.00095460 has been the peak of the market for a while. The last time the price attained to this level was on the 8th of July, the market has been on a downtrend ever since.
However, buyers have increasing their capacity despite the fall of Lblock. The drop in price is an avenue for much buyers to join the the market at the right price level. The price mark has been set at $0.00078000.
On the 13 of July, as anticipated,the price touched down at $0.00078000 and rebounds strongly to halt the downtrend and predispose the market to an uptrend. The Parabolic SAR (Stop and Reverse) dots have aligned below the 1-hour candlesticks to confirm reversal.
LBLOCK/USD Medium-Term Trend: Bullish (5-minute chart)
The coin is now approaching a critical price level of $0.00081040. This is the level at which the bulls are expected to demonstrate their renewed vigour by breaking to the upside. The EFI (Elders Force Index) indicator on the 1hour time frame is rising but below the zero level, it has risen above the zero level on the 5-minute chart. Bulls are getting stronger.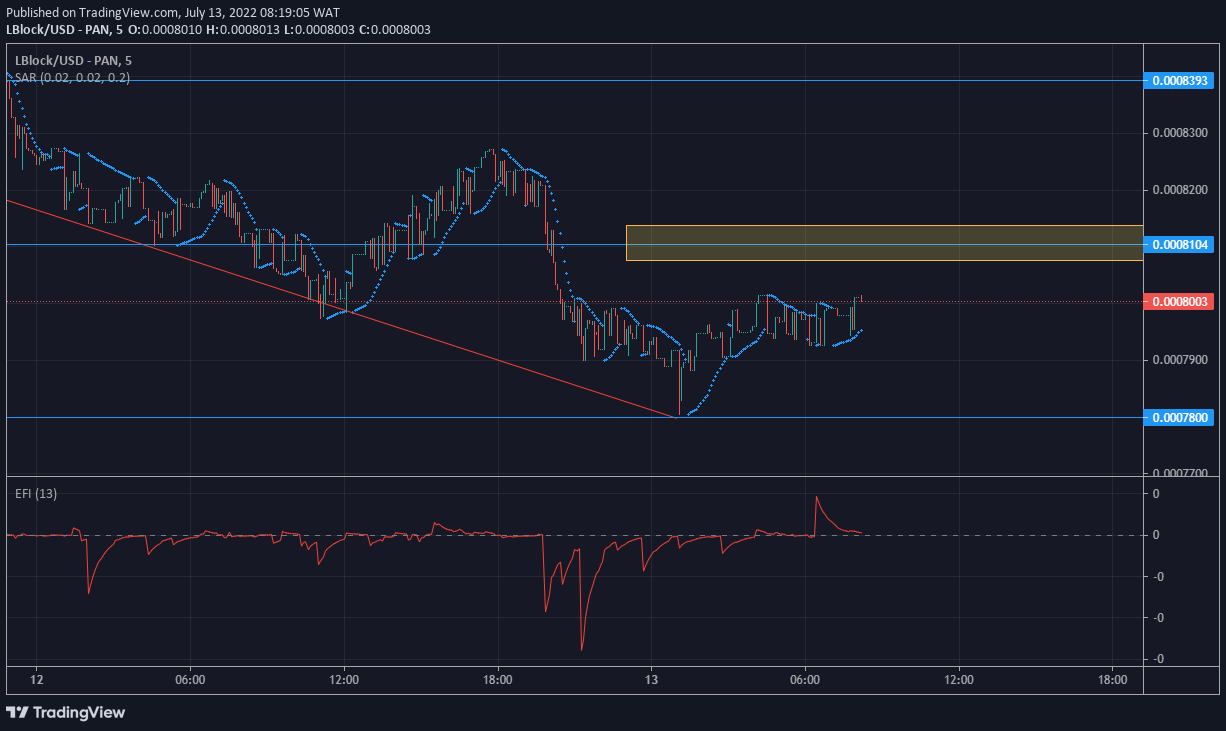
How To Buy Lucky Block – Guide, Tips & Insights | Learn 2 Trade
Note: Learn2.trade is not a financial advisor. Do your research before investing your funds in any financial asset or presented product or event. We are not responsible for your investing results
- Broker
- Min Deposit
- Score
- Visit Broker

- Award-winning Cryptocurrency trading platform
- $100 minimum deposit,
- FCA & Cysec regulated

- 20% welcome bonus of upto $10,000
- Minimum deposit $100
- Verify your account before the bonus is credited
- Fund Moneta Markets account with a minimum of $250
- Opt in using the form to claim your 50% deposit bonus
Learn to Trade
Never Miss A Trade Again

Signal Notification
Real-time signal notifications whenever a signal is opened, closes or Updated

Get Alerts
Immediate alerts to your email and mobile phone.

Entry Price Levels
Entry price level for every signal Just choose one of our Top Brokers in the list above to get all this free.