Key Highlights
LTC/USD piunges to $155 low
Litecoin consolidates above $176
Litcoin ( LTC) Current Statistics
The current price: $178.48
Market Capitalization: $14,763,794,392
Trading Volume: $5,664,951,972
Major supply zones: $400, $420, $440
Major demand zones: $200, $180, $160
Litecoin (LTC) Price Analysis September 8, 2021
Litecoin’s (LTC) price plunged to the previous low at $155 as bulls bought the dips. LTC price corrected upward above $176 as the altcoin resumed consolidation above it. The $176 support is previous support of August 31. On the upside, if buyers push the LTC price , it is likely to retest the previous high of $230. LTC/USD is trading at $185.57 at the time of writing.
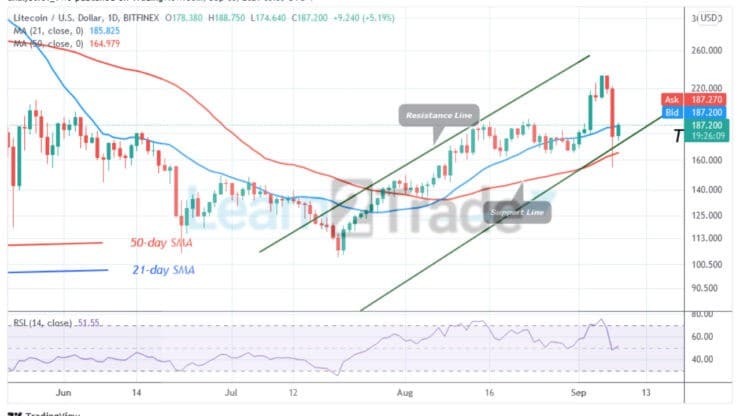
Litecoin (LTC) Technical Indicators Reading
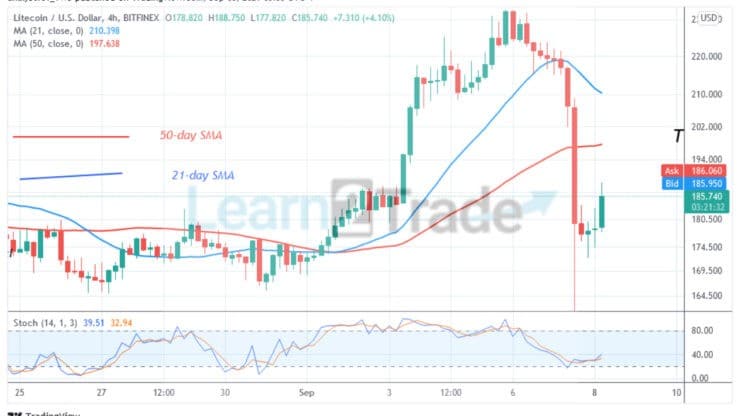
Litecoin is at level 48 of the Relative Strength Index period 14. It indicates that LTC is in the downtrend zone and capable of falling on the downside. The altcoin is above the 25% range of the daily stochastic. It indicates that Litecoin is in a bullish momentum. The 21-day and the 50-day SMAs are sloping downward indicating the downtrend.
Conclusion
On the 4-hour chart, LTC/USD has a breakdown with a candlestick with a long tail. The candlestick tail reached the low of $155 and pulled back. The long tail indicates that there is strong buying pressure below the current support.
You can purchase crypto coins here: Buy Tokens
Note: Learn2.Trade is not a financial advisor. Do your research before investing your funds in any financial asset or presented product or event. We are not responsible for your investing results
- Broker
- Min Deposit
- Score
- Visit Broker

- Award-winning Cryptocurrency trading platform
- $100 minimum deposit,
- FCA & Cysec regulated

- 20% welcome bonus of upto $10,000
- Minimum deposit $100
- Verify your account before the bonus is credited
- Fund Moneta Markets account with a minimum of $250
- Opt in using the form to claim your 50% deposit bonus
Learn to Trade
Never Miss A Trade Again

Signal Notification
Real-time signal notifications whenever a signal is opened, closes or Updated

Get Alerts
Immediate alerts to your email and mobile phone.

Entry Price Levels
Entry price level for every signal Just choose one of our Top Brokers in the list above to get all this free.