Litecoin (LTC) Current Statistics
The current price: $82
Market Capitalization: $6.34 billion
Trading Volume: $497,689,262
Major supply zones: $84, $85, $87
Major demand zones: $77, $75, $72
Litecoin (LTC) Price Analysis December 2, 2025
From the daily chart perspective, the market appears to be attempting a recovery after a period of bearish movement, aiming to shift momentum to the upside. However, the rebound observed in today’s session does not yet reflect sufficient strength to confirm a clear bullish reversal.
That said, the market’s ability to bounce from below the $80 support level demonstrates notable bullish resilience. This area is a key support zone, and a breakdown below it could have easily triggered further sell-offs—but that did not occur. Still, the weak nature of the current recovery may be a contributing factor to the cautious sentiment seen among traders.
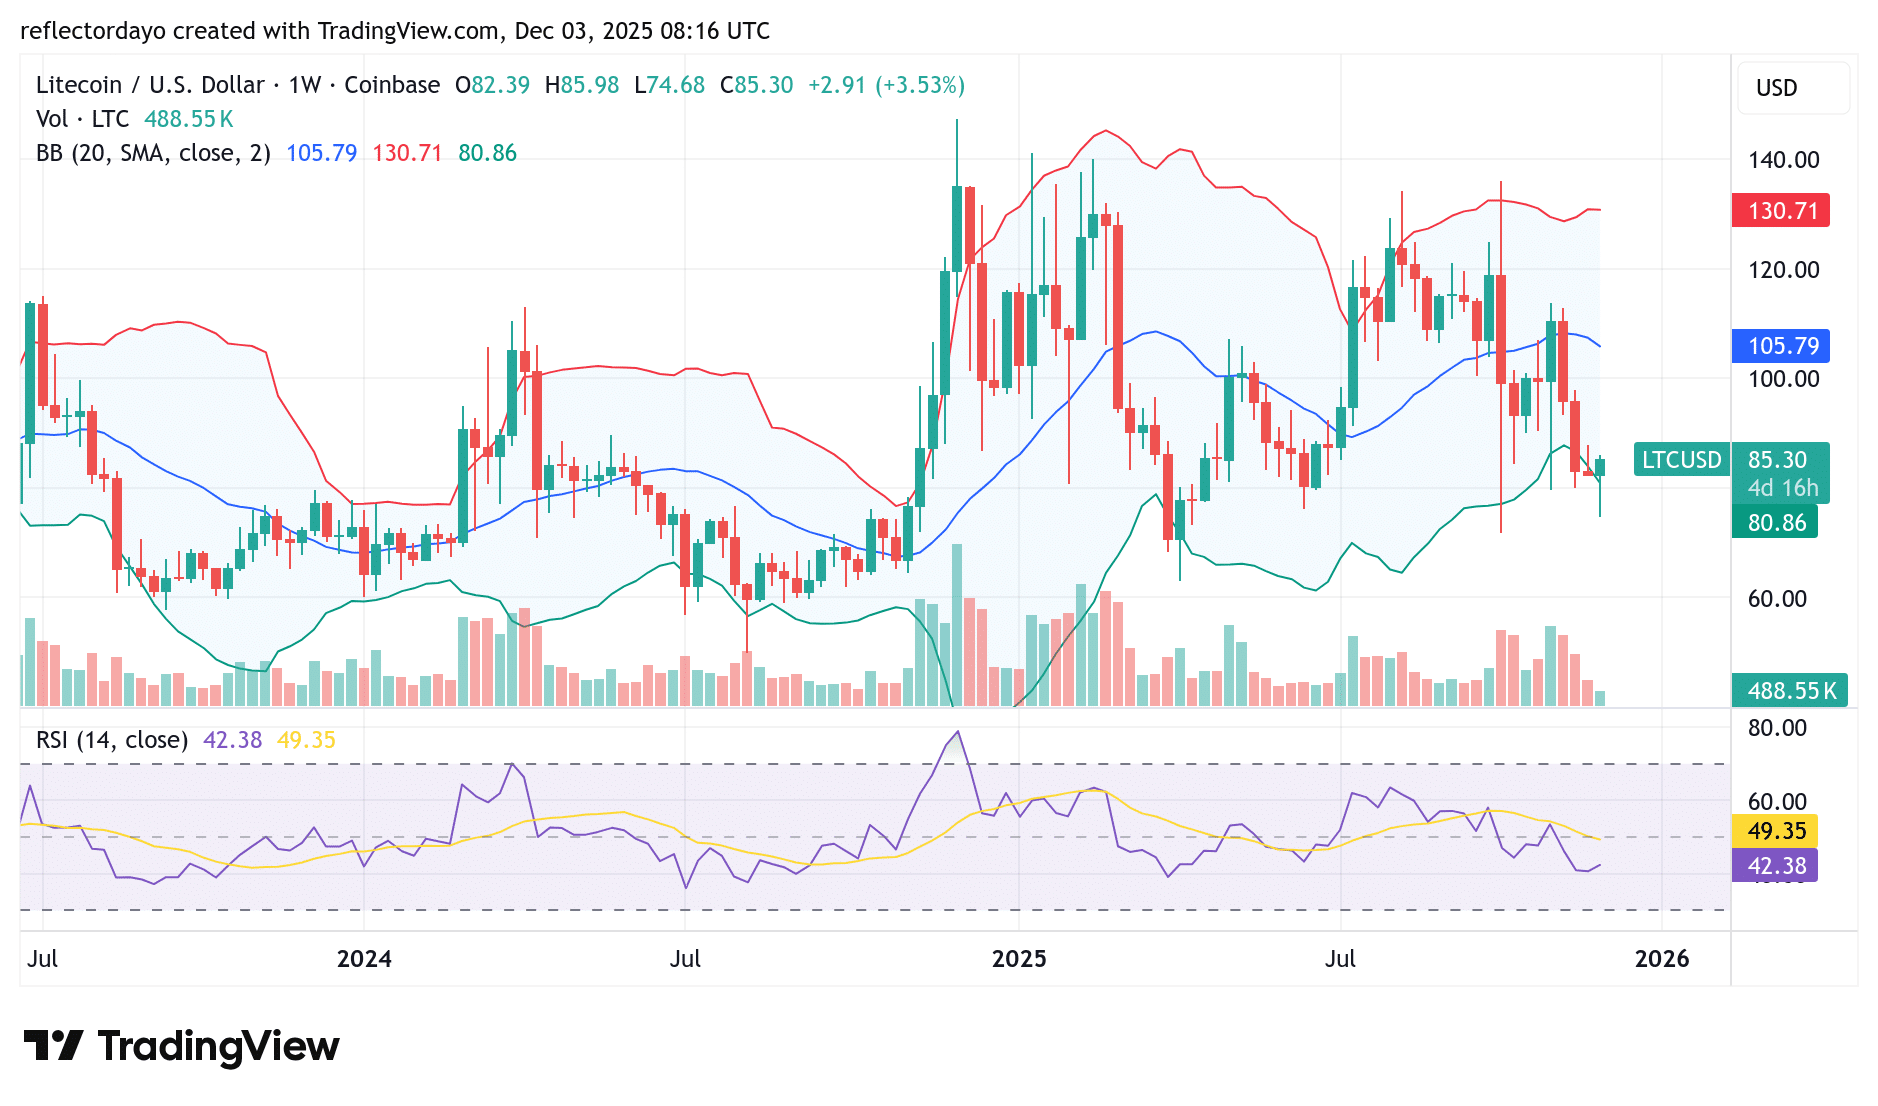
LTC/USD – Weekly Chart
LTC Technical Indicators Reading
Over recent weeks, the Litecoin market has exhibited substantial volatility, with price action oscillating within a wide range between $140 and the $80 support level.
Analyzing the structure of this crypto signal, bearish momentum shows clear signs of exhaustion near the $80 level. This price behavior suggests the downtrend may be concluding, potentially setting the stage for a significant technical rebound.
The resilience of this support is further underscored by the formation of a hammer-like Doji candlestick on the weekly chart. This classic reversal pattern often signals a shift in sentiment and could catalyze a strengthening of near-term bullish bias.
Conclusion
Based on the weekly and daily chart analysis, Litecoin (LTC) finds itself at a critical technical juncture. While the weekly structure reveals compelling signs of bearish exhaustion at the pivotal $80 support level—underscored by the formation of a hammer-like doji—the daily chart shows a recovery attempt that remains tentative. The market has demonstrated resilience by holding this key level, which prevented a deeper sell-off, but the current rebound lacks the conviction required to confirm a sustained bullish reversal.
Ultimately, the evidence suggests the downtrend may be concluding, setting the stage for a potential shift. However, the immediate outlook is one of cautious equilibrium. Traders should monitor for a decisive break above recent recovery highs to confirm that bullish bias is strengthening. Until then, the $80 support zone remains the critical line in the sand, where a breakdown would invalidate the emerging reversal thesis and likely renew selling pressure. 
Make money without lifting your fingers: Start using a world-class auto trading solution.
- Broker
- Min Deposit
- Score
- Visit Broker

- Award-winning Cryptocurrency trading platform
- $100 minimum deposit,
- FCA & Cysec regulated

- 20% welcome bonus of upto $10,000
- Minimum deposit $100
- Verify your account before the bonus is credited
- Fund Moneta Markets account with a minimum of $250
- Opt in using the form to claim your 50% deposit bonus
Learn to Trade
Never Miss A Trade Again

Signal Notification
Real-time signal notifications whenever a signal is opened, closes or Updated

Get Alerts
Immediate alerts to your email and mobile phone.

Entry Price Levels
Entry price level for every signal Just choose one of our Top Brokers in the list above to get all this free.