Key Highlights
Litecoin falls to $118 low
Buyers are likely to emerge
Litcoin ( LTC) Current Statistics
The current price: $175.12
Market Capitalization: $14,527,707,154
Trading Volume: $5,523,308,458
Major supply zones: $200, $220, $240
Major demand zones: $100, $80, $60
Litecoin (LTC) Price Analysis May 25, 2021
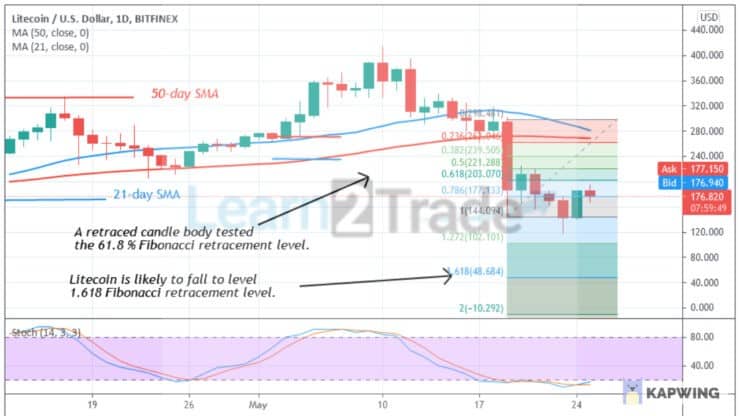
Today, Litecoin drops to $118 low and resumes upward but the uptrend is facing resistance at the recent high. In the previous price action, the coin retested the $220 high and fell to $118 low. However, if the current support holds, Litecoin is likely to be range-bound between $120 and $200. On May 19 downtrend; a retraced candle body tested the 61.8 % Fibonacci retracement level. The retracement indicates that Litecoin is likely to fall to level 1.618 Fibonacci retracement level or level $48.68.
Litecoin (LTC) Technical Indicators Reading
LTC price has fallen below the 20% range of the daily stochastic. It indicates that the coin has reached the oversold region of the market. The implication is that buyers are likely to emerge.
The 21-day and 50-day SMA are sloping horizontally.
Conclusion
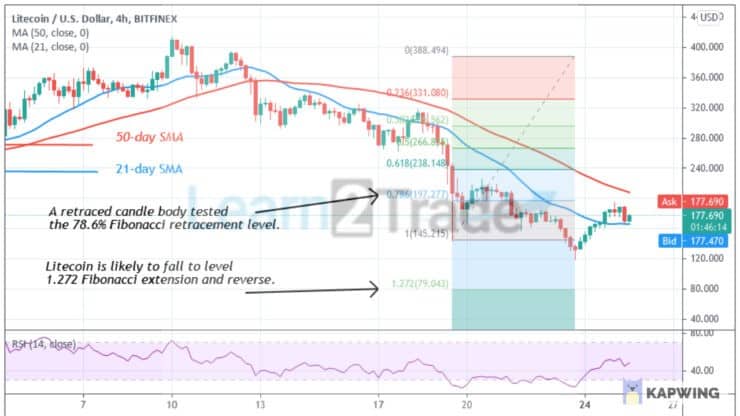
On the 4–hour chart, Litecoin is still in a downward correction. The upward move is facing rejection as price finds support above the 21-day SMA. On May 19 uptrend, a retraced candle body tested the 78.6% Fibonacci retracement level. This retracement indicates that the market will rise to level 1.272 Fibonacci extension or level $102.10.
You can purchase crypto coins here: Buy Coins
Note: Learn2.Trade is not a financial advisor. Do your research before investing your funds in any financial asset or presented product or event. We are not responsible for your investing results
- Broker
- Min Deposit
- Score
- Visit Broker

- Award-winning Cryptocurrency trading platform
- $100 minimum deposit,
- FCA & Cysec regulated

- 20% welcome bonus of upto $10,000
- Minimum deposit $100
- Verify your account before the bonus is credited
- Fund Moneta Markets account with a minimum of $250
- Opt in using the form to claim your 50% deposit bonus
Learn to Trade
Never Miss A Trade Again

Signal Notification
Real-time signal notifications whenever a signal is opened, closes or Updated

Get Alerts
Immediate alerts to your email and mobile phone.

Entry Price Levels
Entry price level for every signal Just choose one of our Top Brokers in the list above to get all this free.