Litecoin (LTC) Price Analysis: Daily Chart – Neutral
Key resistance levels: $64, $72, $80
Key support levels: $52, $47, $40
Litecoin is currently consolidating on the daily chart. Knowing that the market is under long-term bearish control, short-traders are trapped for the past 5 days as the October 25 sudden price increase gave the bulls a sigh of relief. For a bullish continuation, LTC may test the $64 before rising higher to the horizontal resistance (yellow) at $72 and $80. Rise above the horizontal line is a mid-term bullish confirmation.
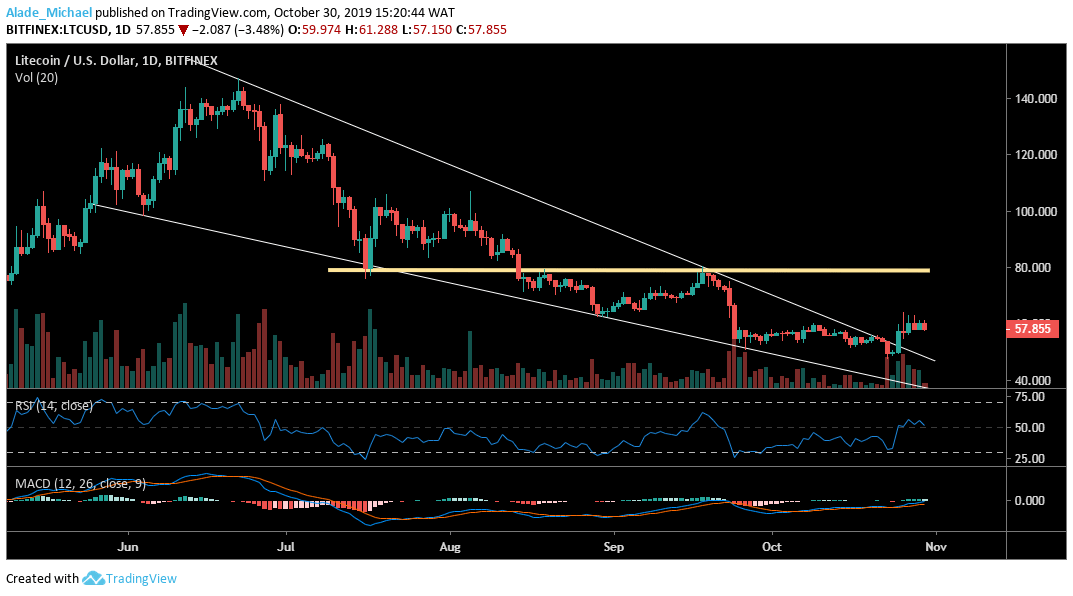
Alternatively, a bullish trap may occur if LTC plummets straight back to the previous support at $52 and $47 and at the same time bringing trade back inside the descending wedge formation. Further support lies at $40. Litecoin is now testing the MACD signal level. A crossover should provide enough strength for the market to go bullish. The RSI is currently waiting at the 50 levels but it may further rise if the level can bolster as support.
Litecoin (LTC) Price Analysis: Hourly Chart – Bearish
Longing Litecoin at this moment could be a wrong position for short-term trader following the latest price break-down on the triangle formation. The ongoing selling pressure may cause Litecoin to fall at $55 and $50 if the supply becomes heavy. However, a false move may turn the bulls back active. Such a move may be unrealistic at the moment, although the market may as well be unpredictable too.
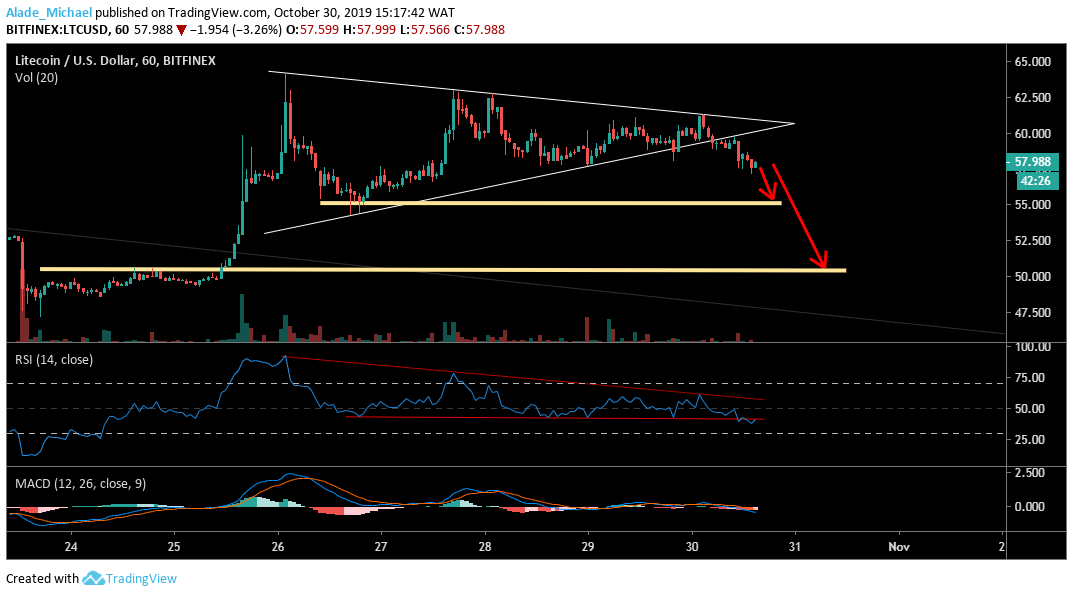
However, resistance to watch out for is $60 and $64 before we can see a further rise. As of now, the MACD has slightly crossed to the negative to show that Litecoin is weakening on the hourly chart. The RSI is currently at the 38 levels, revealing that the sellers are in the market.
LITECOIN SELL SIGNAL
Buy Entry: $57.9
TP: $55/$50
SL: $62
- Broker
- Min Deposit
- Score
- Visit Broker

- Award-winning Cryptocurrency trading platform
- $100 minimum deposit,
- FCA & Cysec regulated

- 20% welcome bonus of upto $10,000
- Minimum deposit $100
- Verify your account before the bonus is credited
- Fund Moneta Markets account with a minimum of $250
- Opt in using the form to claim your 50% deposit bonus
Learn to Trade
Never Miss A Trade Again

Signal Notification
Real-time signal notifications whenever a signal is opened, closes or Updated

Get Alerts
Immediate alerts to your email and mobile phone.

Entry Price Levels
Entry price level for every signal Just choose one of our Top Brokers in the list above to get all this free.