Key Highlights
Litecoin rallies to the high of $90
The crypto may be range-bound between $80 and $90
Litecoin (LTC) Current Statistics
The current price: $89.20
Market Capitalization: $5,900,735,267
Trading Volume: $7,953,660,011
Major supply zones: $70, $80, $90
Major demand zones: $50, $30, $10
Litecoin (LTC) Price Analysis November 24, 2020
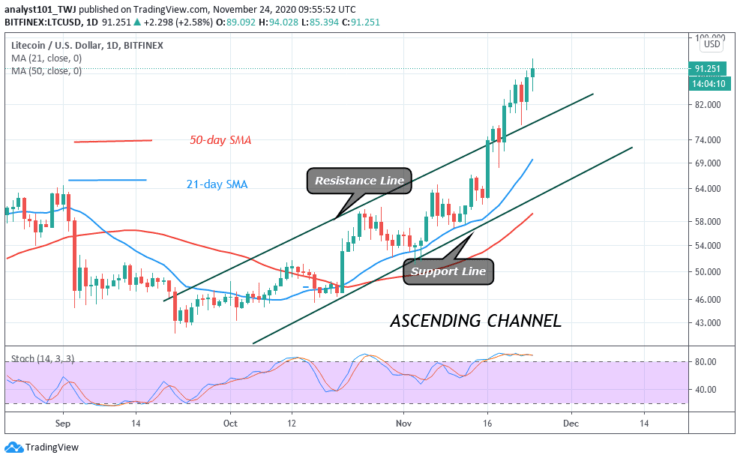
Litecoin has continued its rallies as the coin reached a high of $89.86. LTC price has been making a series of higher highs and higher lows. The upward move has been facing resistance at $90. On the upside, if buyers can push LTC above $90, the coin will rally above $100 high. However, if buyers fail to resume the upside momentum, LTC will be compelled to a sideways move for a few days. If the uptrend is resisted the coin will be range bound between $80 and $90.
Litecoin (LTC) Technical Indicators Reading
LTC price broke the resistance line of the ascending channel. This indicates a further upward movement of the coin. The crypto is at level 74 of the Relative Strength Index period 14. It indicates that the coin is in the overbought region of the market.
Conclusion
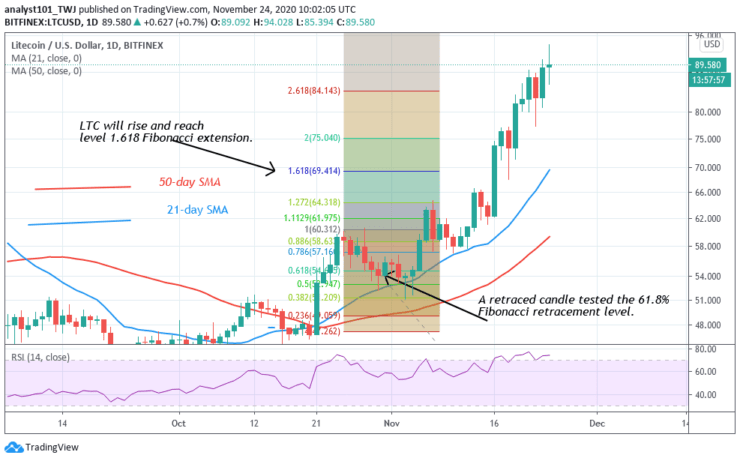
Litecoin has made an impressive bullish run on the upside. Nevertheless, the retraced candle body on October 31 tested the 61.8% Fibonacci retracement level. It indicates that the coin will rise to a level of 1.618 Fibonacci extension level. This extension is equivalent to $70 high. Meanwhile, the price action is above the projected price level.
Note: Learn2.Trade is not a financial advisor. Do your research before investing your funds in any financial asset or presented product or event. We are not responsible for your investing results
- Broker
- Min Deposit
- Score
- Visit Broker

- Award-winning Cryptocurrency trading platform
- $100 minimum deposit,
- FCA & Cysec regulated

- 20% welcome bonus of upto $10,000
- Minimum deposit $100
- Verify your account before the bonus is credited
- Fund Moneta Markets account with a minimum of $250
- Opt in using the form to claim your 50% deposit bonus
Learn to Trade
Never Miss A Trade Again

Signal Notification
Real-time signal notifications whenever a signal is opened, closes or Updated

Get Alerts
Immediate alerts to your email and mobile phone.

Entry Price Levels
Entry price level for every signal Just choose one of our Top Brokers in the list above to get all this free.