Litecoin (LTC) Price Analysis: 2H Chart – Bearish
Key resistance levels: $45, $46, $47
Key support levels: $43, $42, $41
Litecoin is currently on a downward range, though the market has been trading below $45 for the past four days now. The recent price rejection at $44 is likely to cause a serious selling pressure in the market as $43 support may be explored soon. It may even get uglier if the LTC supplies below the descending wedge, reaching $42 and $41 support in no time.
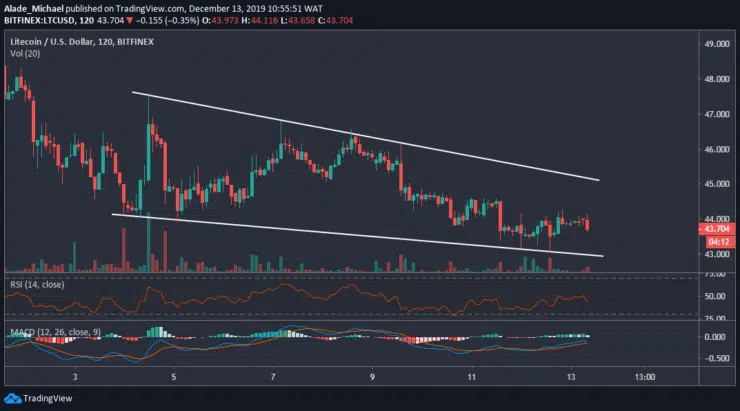
Reclaiming $45 could be a bit tough for the buyers. But if they push through price to the upper boundary of the wedge, we can expect further buying at $46 and $47 resistance. Litecoin has shown a sign of small recovery in the technical indicators. A bullish move would confirm as soon as the MACD and RSI cross their immediate resistance. As of now, the downtrend remains significant on the 2-hours time frame.
Litecoin (LTC) Price Analysis: 30M Chart – Bearish
The 30-minutes chart for Litecoin shows that the market has continued to respect the white regression line drawn from December 9. Minutes ago, LTC got rejected again at the white line after a small correction to $44. Following the latest bearish formation, a possible sell is likely to $43 support, where the LTC is currently relying on.
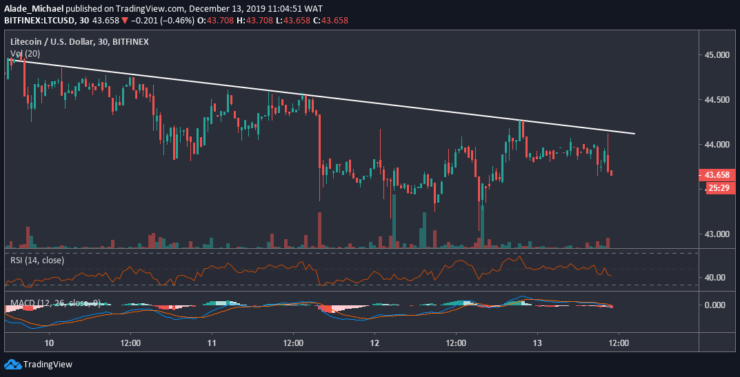
A fresh weekly low could print at $42 if the current support dips. As revealed on the technical indicators, Litecoin is nearing towards the oversold region. If the buyers can counter the current bearish setup, the market could climb back to $44 with a potential break to $45 resistance. Notwithstanding, the bears are still gaining control of the market.
LITECOIN BUY SIGNAL
Buy Entry: $44.5
TP: $46
SL: $43
- Broker
- Min Deposit
- Score
- Visit Broker

- Award-winning Cryptocurrency trading platform
- $100 minimum deposit,
- FCA & Cysec regulated

- 20% welcome bonus of upto $10,000
- Minimum deposit $100
- Verify your account before the bonus is credited
- Fund Moneta Markets account with a minimum of $250
- Opt in using the form to claim your 50% deposit bonus
Learn to Trade
Never Miss A Trade Again

Signal Notification
Real-time signal notifications whenever a signal is opened, closes or Updated

Get Alerts
Immediate alerts to your email and mobile phone.

Entry Price Levels
Entry price level for every signal Just choose one of our Top Brokers in the list above to get all this free.