Key Highlights
Litecoin fluctuates between levels $120 and $140, may retest level $140
LTC likely to encounter a breakdown or breakout
Litecoin (LTC) Current Statistics
The current price: $126.15
Market Capitalization: $10,573,795,500
Trading Volume: $9,274,658,781
Major supply zones: $120, $140, $160
Major demand zones: $90, $70, $50
Litecoin (LTC) Price Analysis December 29, 2020
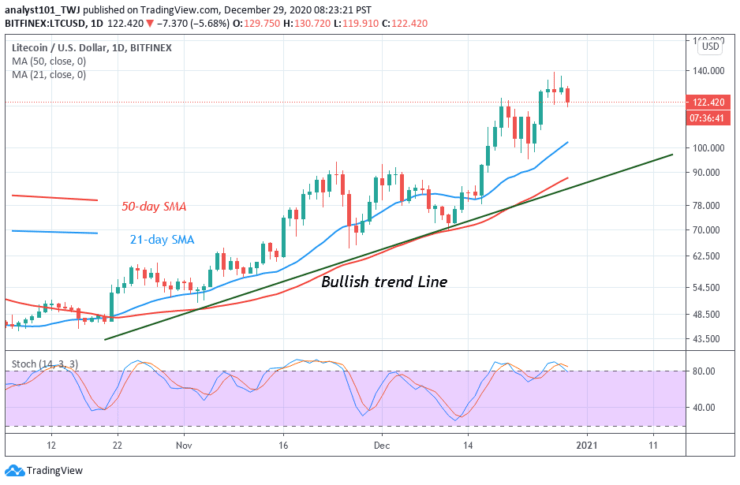
Litecoin has broken the resistance at $124 as the altcoin pushes to the next resistance. Since December 25, the upward move is facing rejection at the $140 resistance level. Presently, the crypto is fluctuating between levels of $120 and$140. The altcoin has the chance of resuming the upside momentum if it breaks the resistance at $140. If the bulls are successful, the coin will attain a high of $144. On the downside, if the bears break below $120 support, LTC will resume a downward move. The coin will decline to $104 low if the current support cracks.
Litecoin (LTC) Technical Indicators Reading
The altcoin is at level 64 of the Relative Strength period 14. It indicates that the coin is in the uptrend zone. The SMAs are sloping northward indicating the uptrend. The price bars are above the SMAs indicating the uptrend.
Conclusion
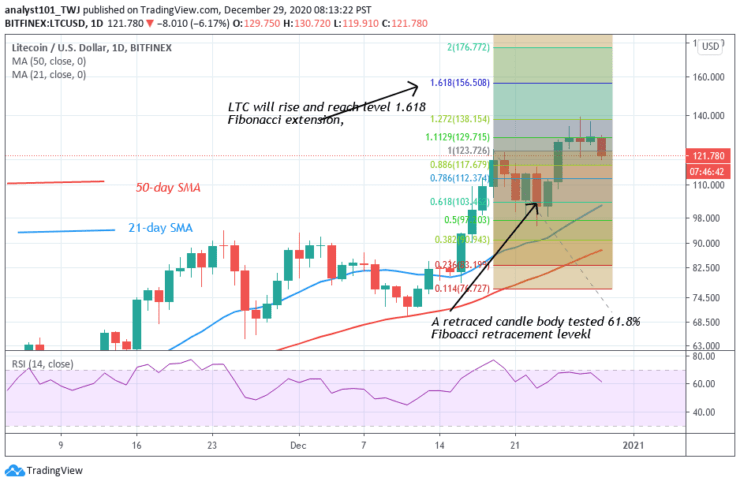
Litecoin has resumed upward move but presently struggling below $140 resistance. On the December 19 uptrend, a retraced candle body tested the 61.8%Fibonacci retracement level. The retracement indicates that the crypto will reach level 1.618 Fibonacci extensions or the high of $156.50.
Note: Learn2.Trade is not a financial advisor. Do your research before investing your funds in any financial asset or presented product or event. We are not responsible for your investing results
- Broker
- Min Deposit
- Score
- Visit Broker

- Award-winning Cryptocurrency trading platform
- $100 minimum deposit,
- FCA & Cysec regulated

- 20% welcome bonus of upto $10,000
- Minimum deposit $100
- Verify your account before the bonus is credited
- Fund Moneta Markets account with a minimum of $250
- Opt in using the form to claim your 50% deposit bonus
Learn to Trade
Never Miss A Trade Again

Signal Notification
Real-time signal notifications whenever a signal is opened, closes or Updated

Get Alerts
Immediate alerts to your email and mobile phone.

Entry Price Levels
Entry price level for every signal Just choose one of our Top Brokers in the list above to get all this free.