Key Support Levels: $50, $30, $10
LTC/USD Price Long-term Trend: Bearish
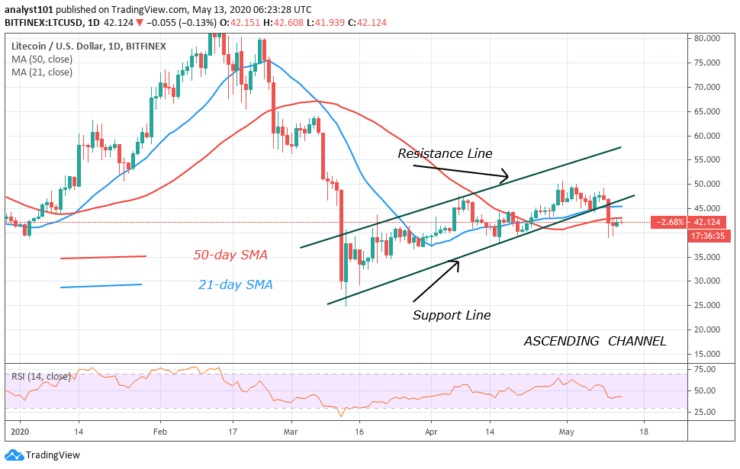
After three unsuccessful attempts to break the $50 overhead resistance, LTC suffers another setback. The market has been falling above $46 support after each resistance. The recent breakdown breaches the support levels of $46 and $44 to reach $39 low. The bulls made a downward correction above $42 and resumed consolidation above it. Nonetheless, with the recent fall, the coin is in the bearish trend zone. A further downward move is likely.
Daily Chart Indicators Reading:
The 21-day SMA and 50-day are sloping downward indicating a downtrend. LTC is at level 43 of the Relative Strength Index period 14. The coin is in the downtrend and it is likely to fall.
LTC/USD Medium-term Trend: Bearish
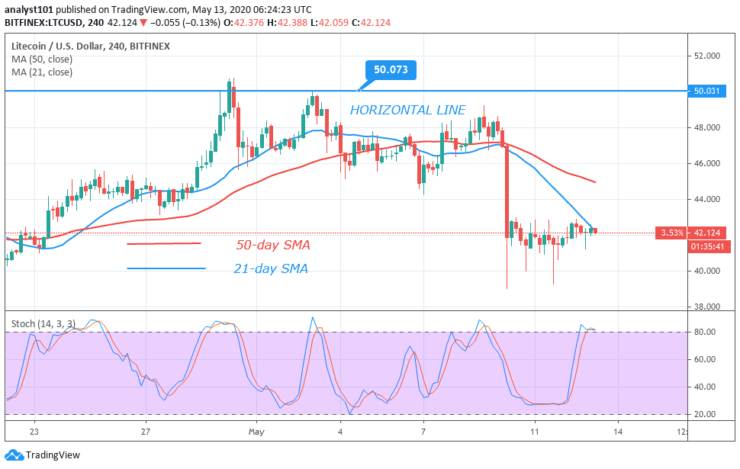
On the 4 hour chart, the bulls fail to break the horizontal line, propelling the bears to take advantage. Presently, price fell above $42 and resume consolidation.
4-hour Chart Indicators Reading
The 21-day and 50-day SMAs are sloping downward. LTC is above 80% range of the daily stochastic. The market is said to be in the overbought region. We expect sellers to emerge to push prices downward.
General Outlook for LTC
Litecoin is on a downward move. The stochastic is already showing overbought condition. The implication is that LTC is likely to fall. The upward move is unlikely at the moment. The price action is also showing bearish signal.
Note: Learn2.Trade is not a financial advisor. Do your research before investing your funds in any financial asset or presented product or event. We are not responsible for your investing results
- Broker
- Min Deposit
- Score
- Visit Broker

- Award-winning Cryptocurrency trading platform
- $100 minimum deposit,
- FCA & Cysec regulated

- 20% welcome bonus of upto $10,000
- Minimum deposit $100
- Verify your account before the bonus is credited
- Fund Moneta Markets account with a minimum of $250
- Opt in using the form to claim your 50% deposit bonus
Learn to Trade
Never Miss A Trade Again

Signal Notification
Real-time signal notifications whenever a signal is opened, closes or Updated

Get Alerts
Immediate alerts to your email and mobile phone.

Entry Price Levels
Entry price level for every signal Just choose one of our Top Brokers in the list above to get all this free.