Key Highlights
Litecoin faces rejection at the $196 high
The selling pressure is likely to resume on the downside
Litecoin (LTC) Current Statistics
The current price: $191.52
Market Capitalization: $191.52
Trading Volume: $3,350,073,388
Major supply zones: $200, $220, $240
Major demand zones: $100, $80, $60
Litecoin (LTC) Price Analysis March 30, 2021
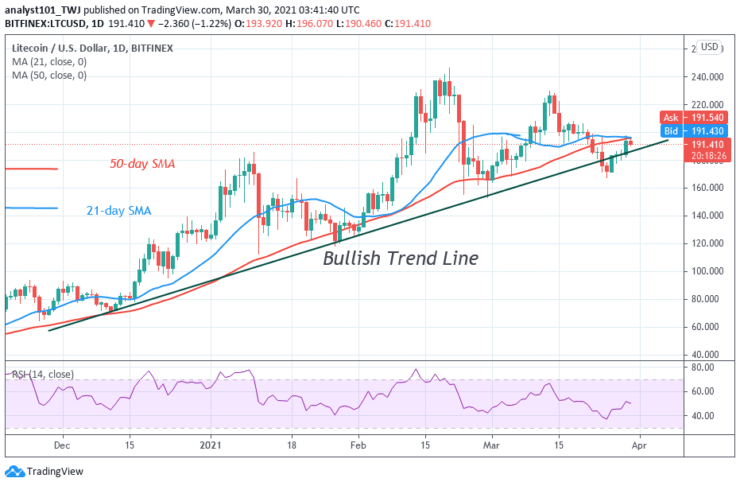
Litecoin price is falling after retesting the $196 resistance. The crypto is falling because the market has reached the overbought region. There is a likelihood of price falling to revisit the previous low at $170. In the previous price action, buyers pushed LTC to the high of $194. Consequently, LTC slumped to $170 low. The bulls bought the dips to push LTC to retest the recent high. However, if price retraces and finds support above $190, the uptrend will resume. Otherwise, the downtrend will continue to the previous low.
Litecoin (LTC) Technical Indicators Reading
On the daily chart, the crypto’s price is below the moving averages. This suggests that LTC is capable of declining on the downside. Nonetheless, LTC is at level 51 of the Relative Strength Index period 14. It indicates that there is a balance between supply and demand.
Conclusion
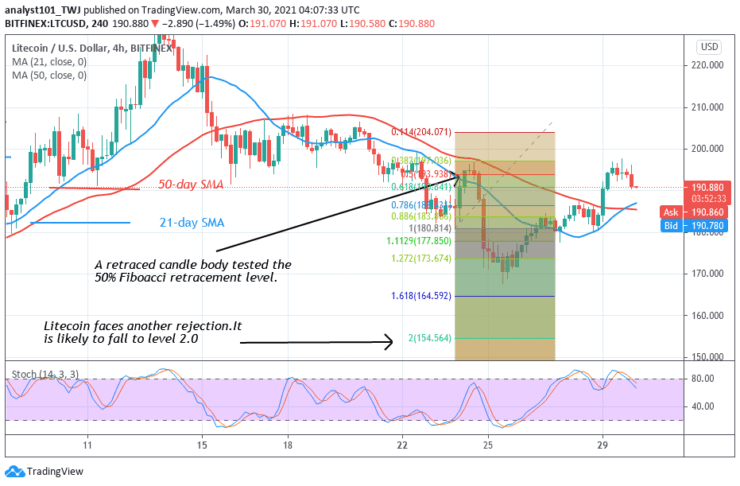
Litecoin is likely to retrace because of the rejection at $196. Meanwhile, on March 23 downtrend, a retraced candle body tested the 50% Fibonacci retracement level. The retracement indicates that the crypto will fall to level 2.0 Fibonacci extensions or the low of $164.59.
You can purchase crypto coins here: Buy Coins
Note: Learn2.Trade is not a financial advisor. Do your research before investing your funds in any financial asset or presented product or event. We are not responsible for your investing results
- Broker
- Min Deposit
- Score
- Visit Broker

- Award-winning Cryptocurrency trading platform
- $100 minimum deposit,
- FCA & Cysec regulated

- 20% welcome bonus of upto $10,000
- Minimum deposit $100
- Verify your account before the bonus is credited
- Fund Moneta Markets account with a minimum of $250
- Opt in using the form to claim your 50% deposit bonus
Learn to Trade
Never Miss A Trade Again

Signal Notification
Real-time signal notifications whenever a signal is opened, closes or Updated

Get Alerts
Immediate alerts to your email and mobile phone.

Entry Price Levels
Entry price level for every signal Just choose one of our Top Brokers in the list above to get all this free.