Key Highlights
LTC price battles the resistance $73
LTC/USD fluctuates between $64 and $73
Litecoin (LTC) Current Statistics
The current price: $71.15
Market Capitalization: $5,981,734,948
Trading Volume: $769,175,388
Major supply zones: $200, $220, $240
Major demand zones: $100, $80, $60
Litecoin (LTC) Price Analysis May 17, 2022
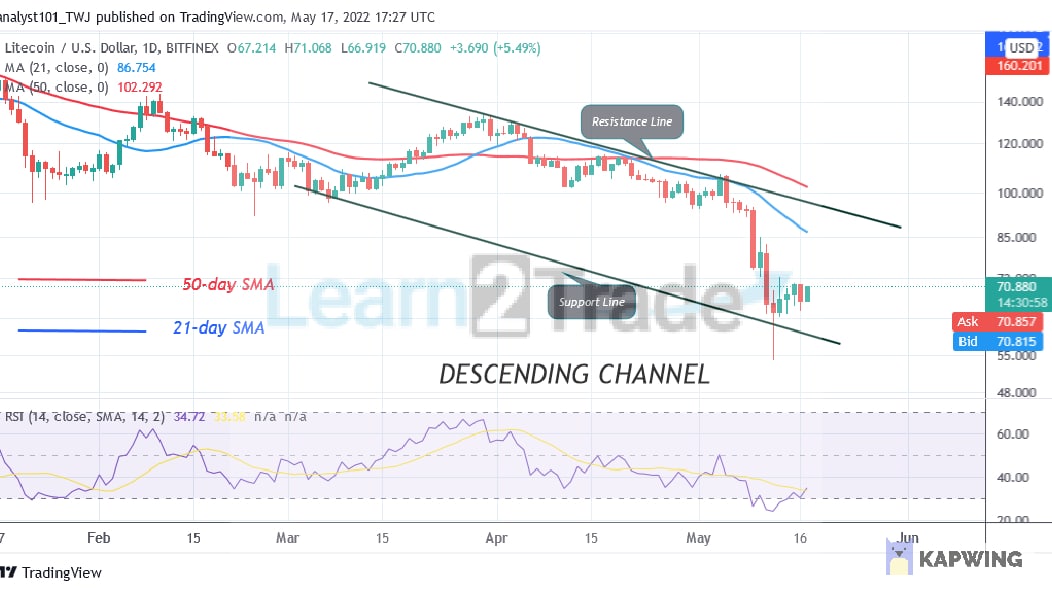
Litecoin’s (LTC) price is in a downtrend but unable to sustain above $73 High. Litecoin fell to the low of $57 but pulled above $64 support. Since May 12, the LTC price has been consolidating above the $64 support. Buyers have failed to push LTC prices to the previous highs. The bulls could not break the resistance at $73 as the altcoin resumed a sideways move below the resistance level. On the upside, if the bulls had broken the resistance at $73, Litecoin would have rallied to $100 high. On the downside, the bulls have been defending the current support. On May 12, the candlestick has a protruding tail. This indicates that the current support has strong buying pressure.
Litecoin (LTC) Technical Indicators Reading
Litecoin is at level 36 of the Relative Strength Index for period 14. The crypto is in the downtrend zone but the altcoin is correcting upward. It is above the 25% area of the daily stochastic. It indicates that the market is in a bullish momentum. The 21-day line SMA and the 50-day SMA are sloping downward indicating a downtrend.
Conclusion
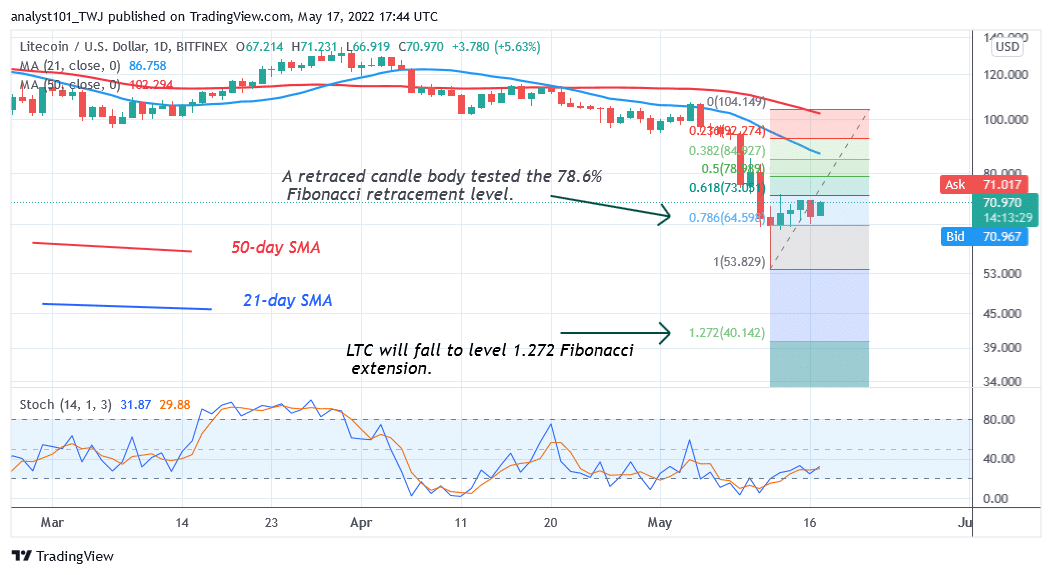
Litecoin is trading in a tight range as it fluctuates between $63 and $73 price levels but unable to sustain above $73 High. Today, the LTC price is falling after retesting the resistance zone. Meanwhile, on May 12 downtrend; a retraced candle body tested the 78.6% Fibonacci retracement level. The retracement indicates that LTC will fall to level 1.272 Fibonacci extension or $40.14.
You can purchase crypto coins here: Buy LBlocK
Note: Learn2.Trade is not a financial advisor. Do your research before investing your funds in any financial asset or presented product or event. We are not responsible for your investing results
- Broker
- Min Deposit
- Score
- Visit Broker

- Award-winning Cryptocurrency trading platform
- $100 minimum deposit,
- FCA & Cysec regulated

- 20% welcome bonus of upto $10,000
- Minimum deposit $100
- Verify your account before the bonus is credited
- Fund Moneta Markets account with a minimum of $250
- Opt in using the form to claim your 50% deposit bonus
Learn to Trade
Never Miss A Trade Again

Signal Notification
Real-time signal notifications whenever a signal is opened, closes or Updated

Get Alerts
Immediate alerts to your email and mobile phone.

Entry Price Levels
Entry price level for every signal Just choose one of our Top Brokers in the list above to get all this free.