Key Highlights
LTC/USD is in a downward correction between $163 and $190
Litecoin is trading at $170 high
Litcoin ( LTC) Current Statistics
The current price: $171.02
Market Capitalization: $14,418,302,165
Trading Volume: $2,274,197,774
Major supply zones: $400, $420, $440
Major demand zones: $200, $180, $160
Litecoin (LTC) Price Analysis August 31, 2021
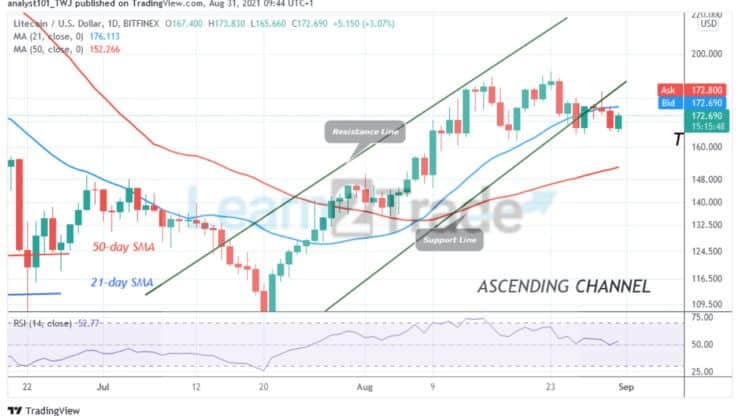
Litecoin’s (LTC) price is in a sideways trend below the $190 resistance level. For the past weeks, Litecoin has been fluctuating between levels $163 and $190. Today, the altcoin is resuming upward after falling to the lower price range. The market is rising to retest the overhead resistance at $190. LTC/USD will resume an uptrend if the resistance at $190 is breached. If buyers are successful, the altcoin will reach $240 high. On the other, if the bears break below the lower price range at $163. Litecoin will further decline to $152 low .
Litecoin (LTC) Technical Indicators Reading
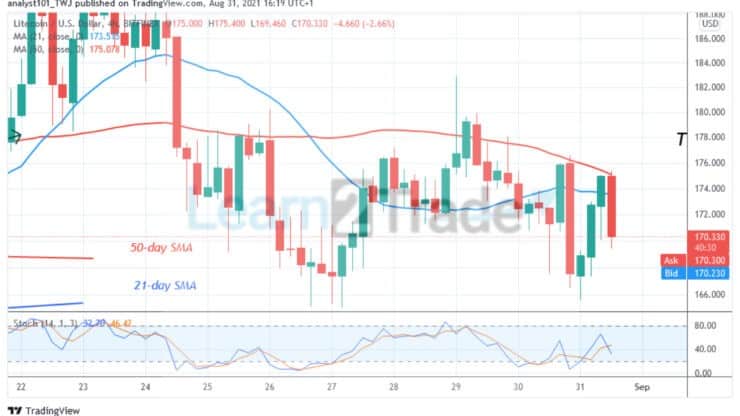
Litecoin is at level 51 of the Relative Strength Index period 14. It indicates that there is a balance between supply and demand. The altcoin is below the 40% range of the daily stochastic. The 21-day and the 50-day SMAs are sloping upward indicating the uptrend.
Conclusion
Today, Litecoin was making upward correction before it was repelled at $175. LTC price is declining and may find support above the lower price range. In previous price action, buyers defended the current support.
You can purchase crypto coins here: Buy Tokens
Note: Learn2.Trade is not a financial advisor. Do your research before investing your funds in any financial asset or presented product or event. We are not responsible for your investing results
- Broker
- Min Deposit
- Score
- Visit Broker

- Award-winning Cryptocurrency trading platform
- $100 minimum deposit,
- FCA & Cysec regulated

- 20% welcome bonus of upto $10,000
- Minimum deposit $100
- Verify your account before the bonus is credited
- Fund Moneta Markets account with a minimum of $250
- Opt in using the form to claim your 50% deposit bonus
Learn to Trade
Never Miss A Trade Again

Signal Notification
Real-time signal notifications whenever a signal is opened, closes or Updated

Get Alerts
Immediate alerts to your email and mobile phone.

Entry Price Levels
Entry price level for every signal Just choose one of our Top Brokers in the list above to get all this free.