Don’t invest unless you’re prepared to lose all the money you invest. This is a high-risk investment and you are unlikely to be protected if something goes wrong. Take 2 minutes to learn more
The JASMYUSDT market has witnessed a consistent price decline for about nineteen sessions. Nevertheless, it can be seen that the market has made an impressive recovery from its all-time low of $0.008373 in 2021. Considering the long-term market trend, it should be noted that it has been making higher supports.
Key Price Levels:
Resistance: $0.02500, $0.03000, and $0.03500
Support: $0.02000, $0.01500, and $0.01000
.02000 Support Line" width="580" height="308" data-lazy-src="https://learn2.trade/wp-content/uploads/2024/07/JASMYUSDT_2024-07-06_06-52-22_065531-1024x543.png"/>
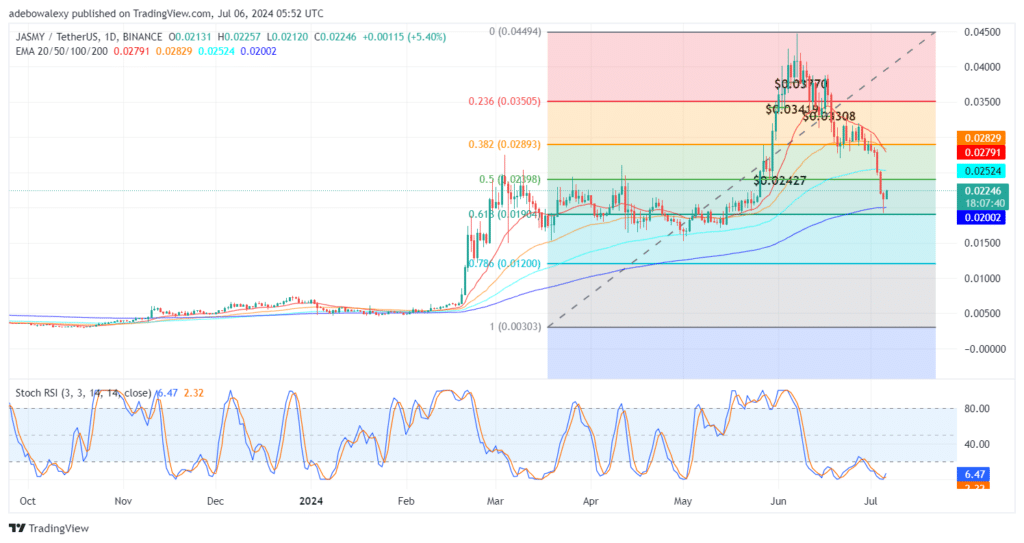
Jasmy Market Builds on Previous Positive Contractions
As soon as price action tested the support at the $0.02000 mark in the JASMYUSDT daily market, an upside contraction occurred in the session. Subsequently, the following session (today’s session) continued the upside move as the corresponding price candle appeared green and pushed the market forward.
Nevertheless, trading remains below the 20, 50, and 100-day Exponential Moving Average (EMA) lines. Meanwhile, the Stochastic Relative Strength Index (SRSI) indicator has delivered a bullish crossover in the oversold region, and its resulting lines have an upward trajectory.
.02000 Support Line" width="580" height="308" data-lazy-src="https://learn2.trade/wp-content/uploads/2024/07/JASMYUSDT_2024-07-06_06-52-55_065529-1024x543.png"/>
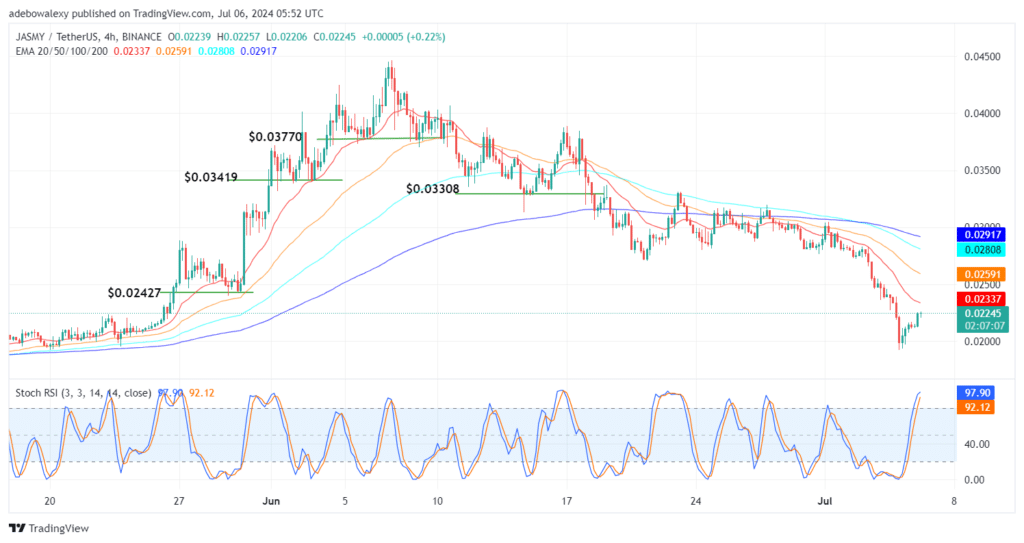
Price Activity in the JASMYUSDT Market May Have Come Under Pressure
The JASMY market can be seen to have fallen below all the EMA lines in the 4-hour market timeframe. However, the market is retracing its steps back upwards. By observing the corresponding price candle for the current session, one can see that it has a tiny body closer to the upper shadow.
Also, it hasn’t moved the market further past the level seen in the previous session, indicating that downward forces are in action. The fact that the market now lies below all the EMA lines poses a significant threat to further price increases in this market. Additionally, the SRSI indicator seems hyper-extended, hinting that upside forces are weakening. At this point, traders may want to use crypto signals that accommodate a minimal correction towards the $0.02200 level while targeting the $0.02500 level.
Trade on MT4 with Leverage up to 1:500! Trade on MT4 with Leverage up to 1:500!
X
We use cookies to ensure that we give you the best experience on our website. If you continue to use this site we will assume that you are happy with it.
 .02000 Support Line" width="580" height="308" data-lazy-src="https://learn2.trade/wp-content/uploads/2024/07/JASMYUSDT_2024-07-06_06-52-22_065531-1024x543.png"/>