Key Resistance Zones: 23200, 23600, 24000
Key Support Zones: 20800, 20400, 20000
Japan 225 (JP225USD) Long-term Trend: Ranging
Japan 225 is fluctuating between levels 22800 and 23600. On October 8, the index reached a high of 23723 but was resisted. For the past week, the market has been on a downward move. However, the range-bound levels have not been broken convincingly since August.
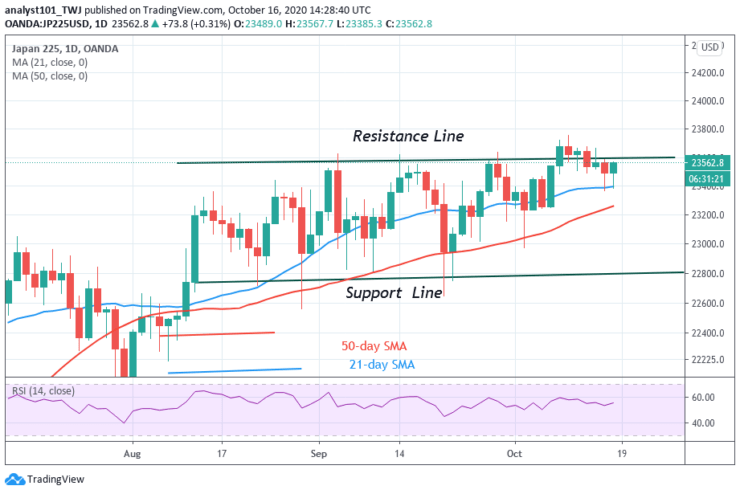
Daily Chart Indicators Reading:
Japan 225 is at level 53 of the Relative Strength Index. It indicates that the market is in the uptrend zone and above the centerline 50. The 21-day SMA and 50-day SMA are sloping upward indicating the upward move.
Japan 225 (JP225USD) Medium-term Trend: Ranging
On the 4- hour chart, the market is in a sideways move. On October 16 uptrend, a retraced candle body tested the 38.2% Fibonacci retracement level. It indicates that the market will rise and reach the 2.618 Fibonacci extension. That is level 23628.
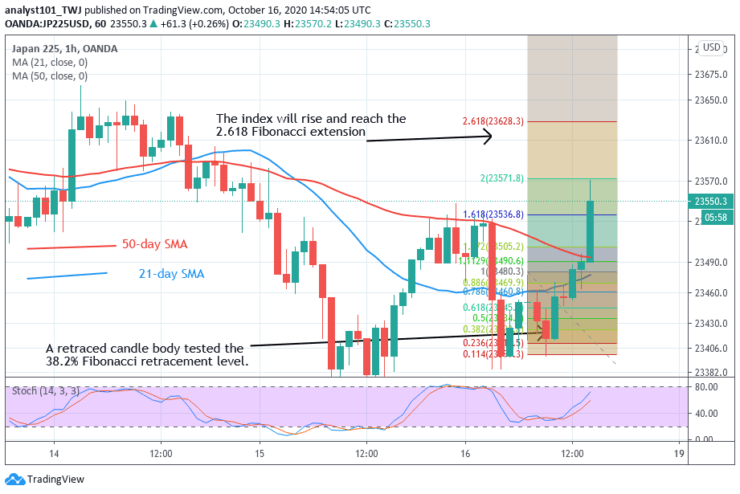
4-hour Chart Indicators Reading
The 21-day SMA and the 50-day SMA are sloping horizontally indicating the sideways move. JP225USD is above the 50% range of the daily stochastic. It implies that the market is in a bullish momentum.
General Outlook for Japan 225 (JP225USD)
Japan 225 index is in a sideways trend. Presently, it is rising and approaching the overbought region. In a short period, the market will resume a downward move.
Note: Learn2Trade.com is not a financial advisor. Do your research before investing your funds in any financial asset or presented product or event. We are not responsible for your investing result
- Broker
- Min Deposit
- Score
- Visit Broker

- Award-winning Cryptocurrency trading platform
- $100 minimum deposit,
- FCA & Cysec regulated

- 20% welcome bonus of upto $10,000
- Minimum deposit $100
- Verify your account before the bonus is credited
- Fund Moneta Markets account with a minimum of $250
- Opt in using the form to claim your 50% deposit bonus
Learn to Trade
Never Miss A Trade Again

Signal Notification
Real-time signal notifications whenever a signal is opened, closes or Updated

Get Alerts
Immediate alerts to your email and mobile phone.

Entry Price Levels
Entry price level for every signal Just choose one of our Top Brokers in the list above to get all this free.