
Key Resistance Zones: 23200, 23600, 24000
Key Support Zones: 20800, 20400, 20000
Japan 225 (JP225USD) Long-term Trend: Bullish
Japan 225 has been in an upward move and has rallied on the upside. The index is facing resistance at level 27000. On November 16 uptrend, a retraced candle body tested the 78.6% Fibonacci retracement level. The retracement indicates that Japan 225 is likely to rise and reverse at level 1.272 Fibonacci extensions. It indicates that the pair will rise and reverse at level 27105.60.

Daily Chart Indicators Reading:
Japan 225 has risen to level 69 of the Relative Strength Index. It indicates that the market is in the uptrend zone. Besides, Index has reached the overbought region of the market. The 21-day SMA and 50-day SMA are sloping upward indicating the uptrend.
Japan 225 (JP225USD) Medium-term Trend: Bullish
On the 4- hour chart, the market is in an upward move. The uptrend has been restricted below the resistance zone. Since November the bulls could break the resistance at level 27000. The index is presently consolidating above the resistance.
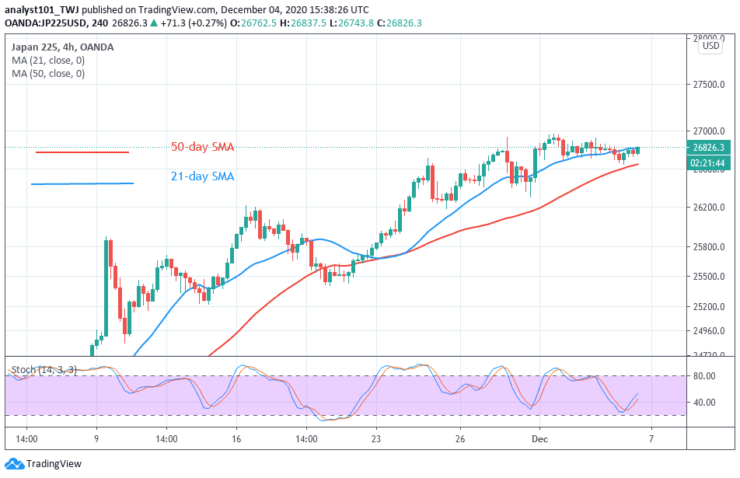
4-hour Chart Indicators Reading
The 21-day SMA and the 50-day SMA are sloping upward indicating the uptrend. JP225USD is above the 40% range of the daily stochastic. The index is in a bullish momentum. The market is in an upward movement.
General Outlook for Japan 225 (JP225USD)
Japan’s 225 is in an upward move. The index is currently facing resistance at level 27000. The price is fluctuating below the resistance zone. According to the Fibonacci tool, the market will reverse at level 1.272 Fibonacci or 27105.60.
Note: Learn2Trade.com is not a financial advisor. Do your research before investing your funds in any financial asset or presented product or event. We are not responsible for your investing results


