Key Resistance Zones: 27200, 27600, 28000
Key Support Zones: 20800, 20400, 20000
Japan 225 (JP225USD) Long-term Trend: Bullish
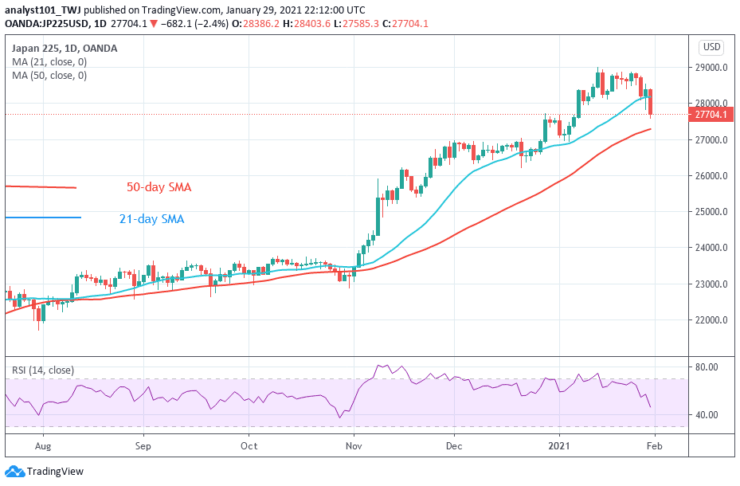
Japan 225 has resumed a downward move after a week of fluctuation below level 29000. The index has fallen and it is approaching the low of level 27000. The price has broken the 21-day SMA. The downward movement will be accelerated if the price breaks below the 50-day SMA.
IndiDaily Chartcators Reading:
Japan 225 has fallen to level 46 of the Relative Strength Index. It indicates that the market is in a downtrend zone. The 21-day SMA and 50-day SMA are sloping upward indicating the uptrend.
Japan 225 (JP225USD) Medium-term Trend: Bearish
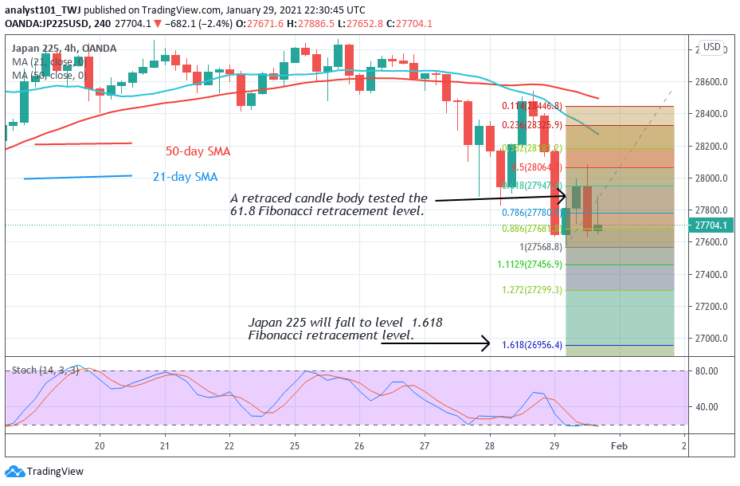
On the 4- hour chart, the index is in a downward move. On January 29 downtrend; a retraced candle body tested the 61.8% Fibonacci retracement level. The retracement gives the impression that the market will fall to level 1.618 Fibonacci extension or 26956.40.
4-hour Chart Indicators Reading
The 21-day SMA and the 50-day SMA are sloping upward indicating the uptrend. JP225USD is below the 25% range of the daily stochastic. The index is in a bearish momentum and it is approaching the oversold region.
General Outlook for Japan 225 (JP225USD)
Japan 225 is in a downward move. According to the Fibonacci tool analysis, the index is likely to further depreciate to level 1.618 or 26956.40.
Note: Learn2Trade.com is not a financial advisor. Do your research before investing your funds in any financial asset or presented product or event. We are not responsible for your investing results
- Broker
- Min Deposit
- Score
- Visit Broker

- Award-winning Cryptocurrency trading platform
- $100 minimum deposit,
- FCA & Cysec regulated

- 20% welcome bonus of upto $10,000
- Minimum deposit $100
- Verify your account before the bonus is credited
- Fund Moneta Markets account with a minimum of $250
- Opt in using the form to claim your 50% deposit bonus
Learn to Trade
Never Miss A Trade Again

Signal Notification
Real-time signal notifications whenever a signal is opened, closes or Updated

Get Alerts
Immediate alerts to your email and mobile phone.

Entry Price Levels
Entry price level for every signal Just choose one of our Top Brokers in the list above to get all this free.