Key Resistance Zones: 23200, 23600, 24000
Key Support Zones: 20800, 20400, 20000
Japan 225 (JP225USD) Long-term Trend: Bullish.
Japan 225 is in an uptrend. The index is rising after falling to level 21675 on June 11. The market is approaching the high of level 22680.80. The previous upward move was resisted at level 23000. On the upside, if the bulls break level 23000, the upward move will be accelerated to reach the high of level 24000.
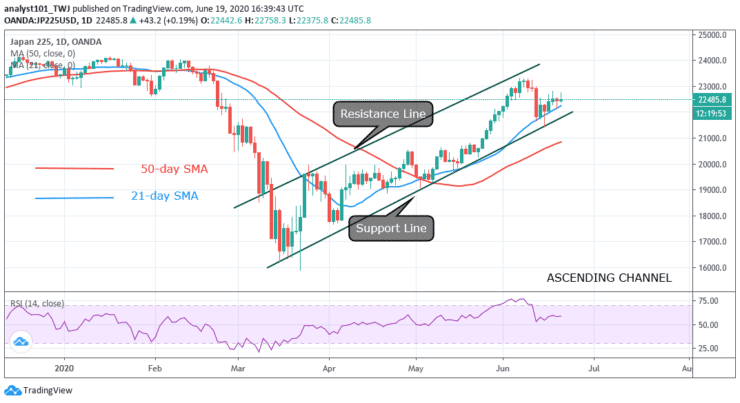
Japan 225 has risen to level 60 of the Relative Strength Index. The index is in the uptrend zone and above the centerline 50. The 21-day SMA and 50-day SMA are sloping upward indicating the uptrend.
Japan 225 (JP225USD) Medium-term Trend: Bullish
On the 4- hour chart, the index is in an uptrend. The upward move is facing resistance at level 22800. On June 17, the bulls were resisted when price tested level 22800. Today, the bulls are testing the same resistance and the index is falling at the time of writing.
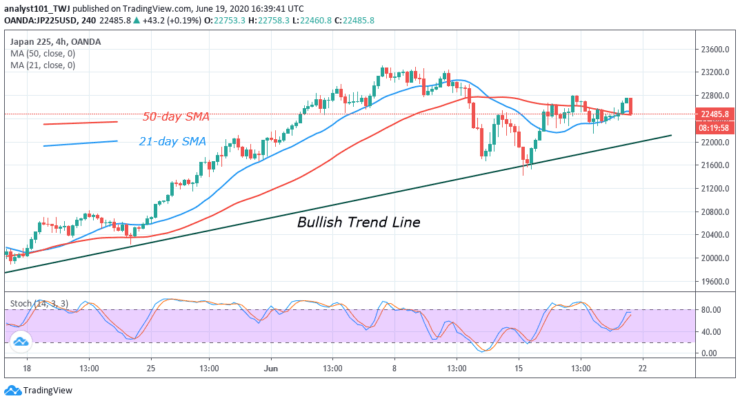
4-hour Chart Indicators Reading
Japan 225 is now above 80% range of the daily stochastic. This indicates that the index is in a bullish momentum and it is approaching the overbought region. The 21-day SMA and the 50-day SMA are sloping upwardly indicating the uptrend.
General Outlook for Japan 225 (JP225USD)
Japan 225 is consolidating between level 22400 and 22800 in the lower time frame. The upward move has been interrupted twice at level 22800. Each time the uptrend is interrupted the market will fall to the support of the 12-day EMA.
Note: Learn2.Trade is not a financial advisor. Do your research before investing your funds in any financial asset or presented product or event. We are not responsible for your investing results
- Broker
- Min Deposit
- Score
- Visit Broker

- Award-winning Cryptocurrency trading platform
- $100 minimum deposit,
- FCA & Cysec regulated

- 20% welcome bonus of upto $10,000
- Minimum deposit $100
- Verify your account before the bonus is credited
- Fund Moneta Markets account with a minimum of $250
- Opt in using the form to claim your 50% deposit bonus
Learn to Trade
Never Miss A Trade Again

Signal Notification
Real-time signal notifications whenever a signal is opened, closes or Updated

Get Alerts
Immediate alerts to your email and mobile phone.

Entry Price Levels
Entry price level for every signal Just choose one of our Top Brokers in the list above to get all this free.